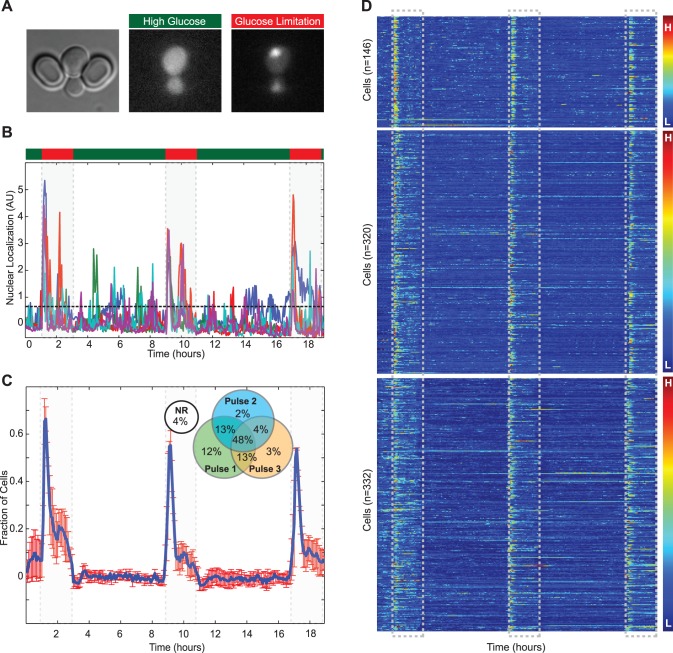
Figure 4. Stress response and learning.
A) An image of a cell in ALCATRAS expressing Msn2p-GFP. Under conditions of high glucose, the majority of signal is localized to the cytoplasm, but almost immediately upon glucose limitation becomes nuclear localized. B) Nuclear localization of five single cells under repeated glucose limitation. Media was repeatedly switched from high glucose (2% - green) for 6 hours to low glucose (0.1% - red) for 2 hours. The dashed line shows the threshold for classification of Msn2p-GFP as being nuclear localized. C) Fraction of cells with nuclear localized Msn2p-GFP (n = 3 experiments, error bars are SEM.) (Inset) A Venn diagram showing the fraction of cells that respond for each of the three pulses over all experiments. The difference in number of cells responding to each of the three pulses was statistically significant (p<0.01). D) A kymograph showing the single cell traces and results for all cells (n = 146, 320, 332). Flow rates were 4.5 µl/min (dominant pump) and 0.5 µl/min. The rates were reversed for media switching which was confirmed by inclusion of cy5 dye in one of the media reservoirs.

