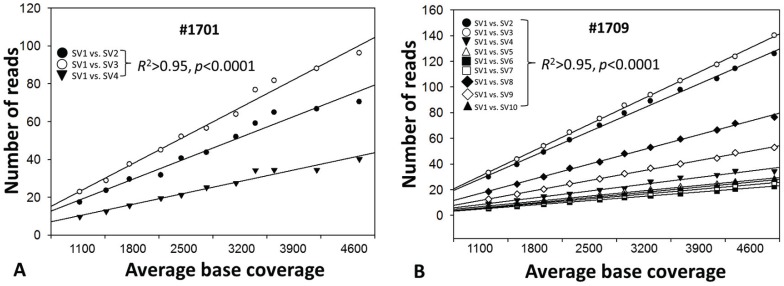
Figure 3. Linear regression analysis of the correlation among reads supporting each HVR1 structural variant (SV) recovered at various sequencing depths in samples #1701 (A) and #1709 (B).
Data were extracted randomly in a range of sequencing depths starting at 1100x, a saturation point for the mutation load. At the depth of 1100x, samples #1701 and #1709 had 4 and 10 HVR1 structural variants, respectively, which were not changed up to the depth of 4600x. In each sample, the correlation between HVR1 structural variant 1 (SV1) and the other variants (SV2 through SV3 in #1701 and SV2 through SV10 in #1709) was highly stable throughout the sequencing depths (all R 2>0.95, p<0.0001).

