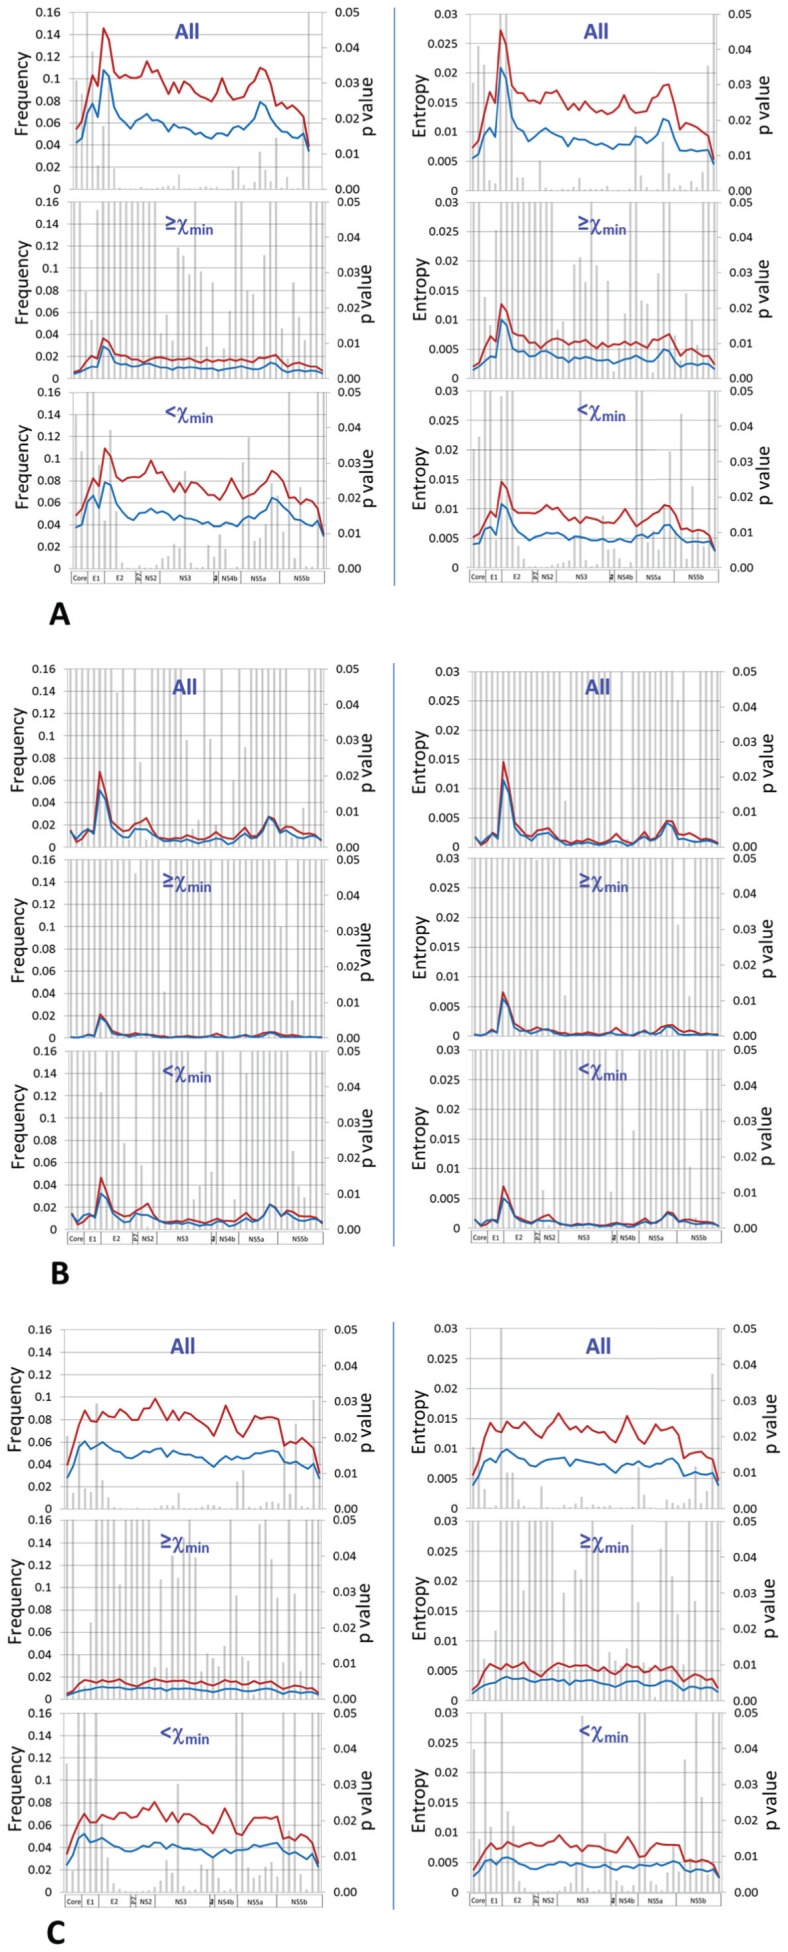
Figure 7. Comparative HCV genome-wide sliding window analyses (window size = 300 bp; overlap = 99 bp) between SVR (blue) and null response group (red) according to mutation nature, including total mutations (A), synonymous mutations (B) and nonsynonymous mutations (C).

Mutations within each category were analyzed separately based on χmin translated value (17.5%), i.e., low or high mutation frequencies. For each window, average mutation frequency per site (left column) and normalized entropy (right column) were compared for statistical significance as represented by bars.
