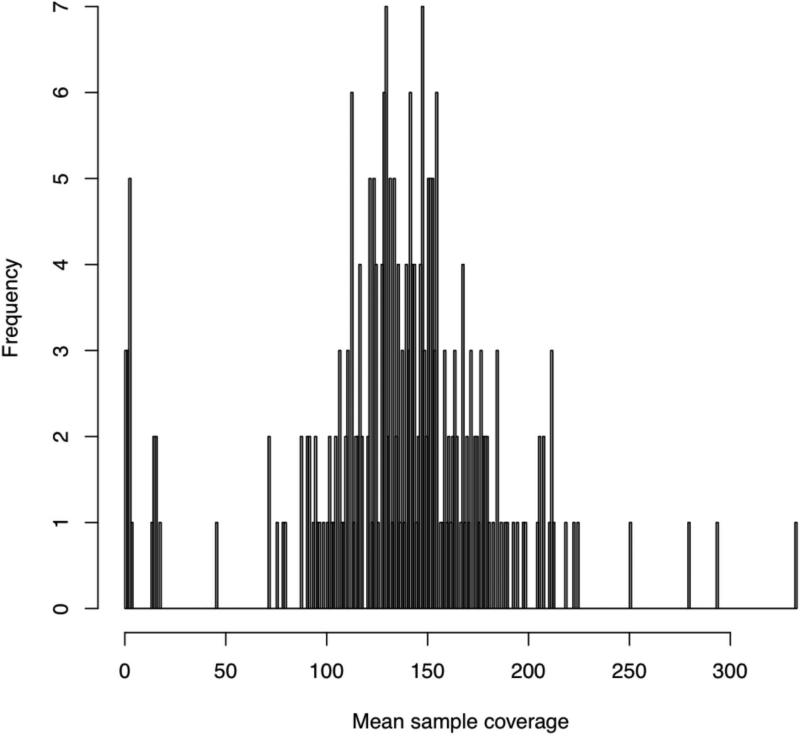
Figure 4. Sample coverage plot.
This shows the sample-wide distribution of exome-wide sequencing coverage, where each per-sample coverage value is the mean of the coverage values calculated for each exome target (which itself is the mean coverage at all of its bases in that particular sample). In this experiment, we sequenced each sample to a mean coverage of 150×, so that we expect a typical sample to indeed have 150 reads covering an average base in an average exome target.

