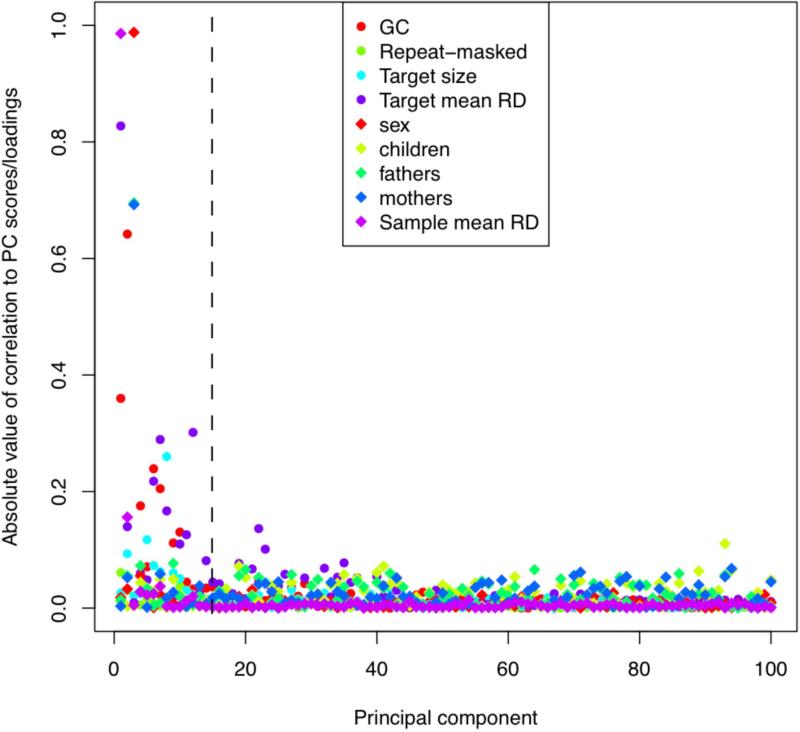
Figure 6. Principal component analysis (PCA) normalization.
This plot compares each of the principal components (PC) to known sample and target features (samples features can be added in step 2E of Basic Protocol 2). The dotted line (at PC = 15) indicates that XHMM automatically removed the first 15 components based on their significant relative variance. In this plot, we consider known sample and target features (that XHMM did not incorporate in its decision to remove them). We see that these first 15 PC tend to show correlation with various target features (colored circles) such as GC content and the mean depth of sequencing coverage at that target, and also with various sample features (colored diamonds) such as gender and mean depth of sequencing for that sample. On the other hand, there is a marked change in quality of the PC after the first 15 or so, with a sudden drop-off in the levels of correlation with genome-wide and batch effects expected to strongly bias the read depth of coverage.

