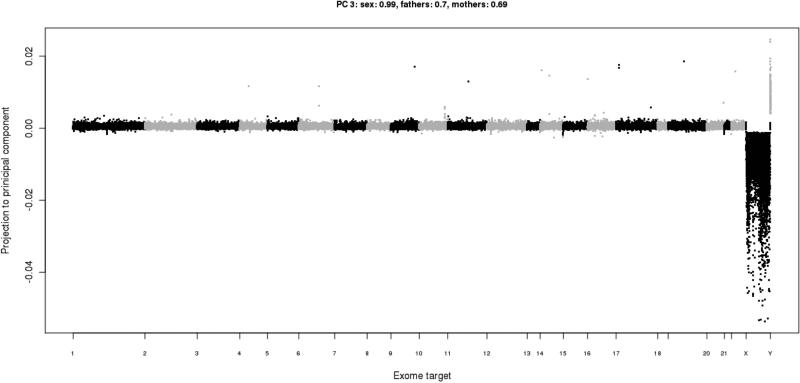
Figure 8. Read depth projected in a principal component.
This principal component (the 3rd one, in this instance) has found the variance in read depth due to gender differences, with males having lower coverage on the X chromosome and higher coverage on the Y. Therefore, the loadings for this component have a correlation of 0.99 with the gender of the samples. Note that the R script creates the ‘PC’ sub-directory, which contains plots of the read depth data projected into each of the principal components: PC/PC.*.png.

