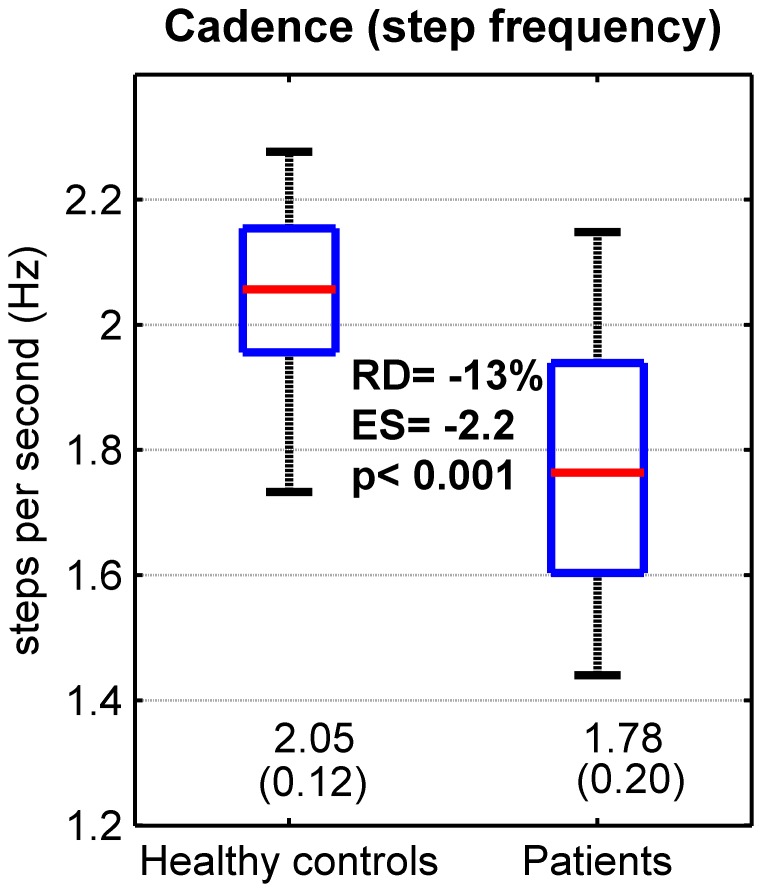
Figure 2. Cadence: descriptive statistics and comparisons between healthy controls and patients.
Forty healthy individuals (Healthy controls) and 83 patients exhibiting mild to moderate neurological disorders (Patients) walked 2×30 sec. at preferred speed. A 3D accelerometer recorded the trunk acceleration. The cadence (or step frequency) was assessed by spectral analysis (Fourier transform) of the vertical acceleration signal. The results of the two 30sec. walking bouts were averaged. The spread of the data among participants is presented with boxplots (median and quartiles). Mean and SD are shown at the bottom of the figure. The bold values are as follows: top: the relative difference (RD) between controls and patients, expressed as percentage; middle: effect size (ES), i.e., mean difference normalized by SD of the controls (Glass's delta); p: p-value of the t-test between controls and patients (unequal variance).

