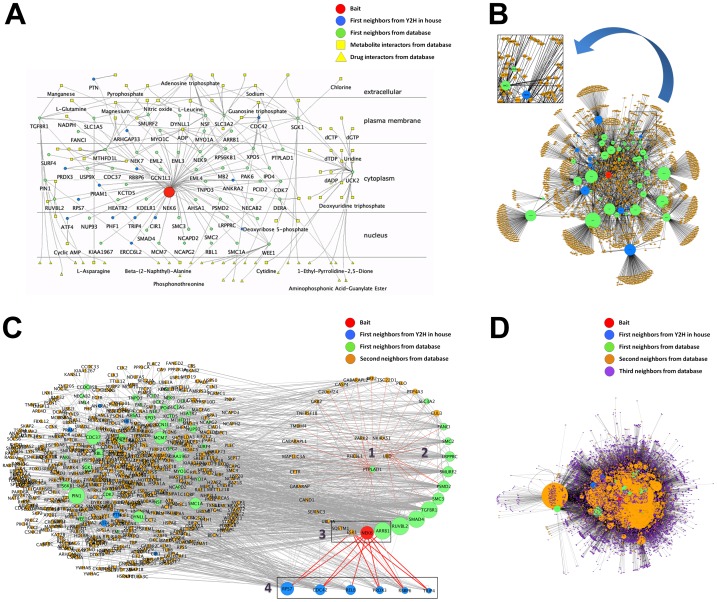
Figure 3. Human Nek6 interactome built from yeast two-hybrid data.
(A) hNek6 first neighbors network, showing the bait hNek6 in red, the Y2H first neighbors in blue, the first neighbors described in the GPMGDID database in green, and the metabolites/drugs interactors described in the GPMGDID database in yellow and in different shapes: squares for metabolites and triangles for drugs. The proteins were localized according to their cellular components (GO) described in the “Selected CC” node attribute field by using the Cerebral Cytoscape plugin. (B) hNek6 second neighbors network, showing the second neighbors in orange. The proteins were distributed according to the organic layout. The insertion is depicting the different edge widths, according to our confidence Class scores. (C) hNek6 second neighbors network showing the following protein clusters: 1. top enriched NF-kappaB cascade, 2. first neighbors of cluster 1, 3. enriched NF-kappaB cascade subset of cluster 2, and 4. hNek6 yeast two-hybrid interactors. The proteins were distributed according to the organic and degree-sorted circle layouts, and proteins with degree 0 and 1 were deleted from the network. (D) hNek6 third neighbors network, showing the expansion from the first to the third level of interaction with the third neighbors in purple. The proteins were distributed according to the organic layout. The networks were visualized using Cytoscape v2.8.3.

