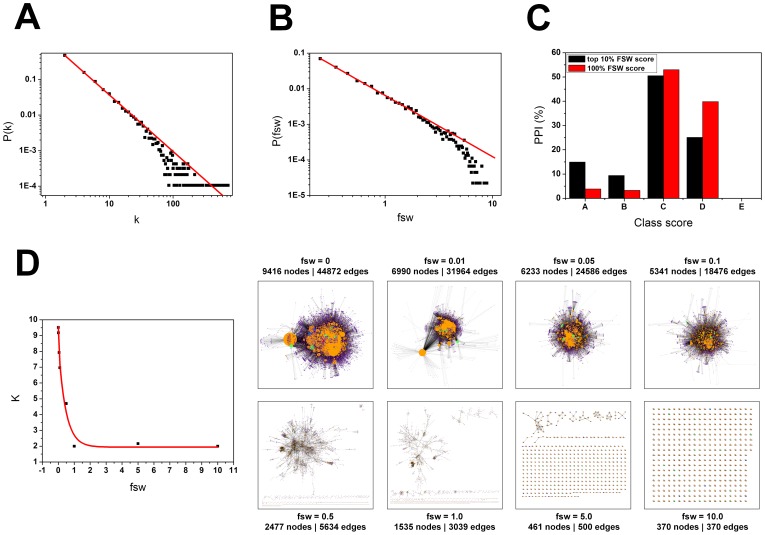
Figure 6. Comparison between FSW score, degree and Class score.
(A) Degree distribution of hNek6 third neighbors network (γ = −1.59). (B) FSW score distribution of hNek6 third neighbors network (γ = −1.72). (C) Percentage of PPIs characterized by the best FSW score and Class score in hNek6 third neighbors network. (D) Correlation between the average degree and the FSW score of hNek6 third neighbors network from FSW score 0 to 10. Both the degree distribution and the FSW score distribution approximate a power-law and are scale-free in topology. The slopes (γ) were determined by linear fitting where P(k) approximates a power-law: P(k)≈k −γ (k: total number of links; K: average degree; γ: slope of the distribution on the log-log plot; fsw: functional similarity weight; PPI: protein-protein interaction).

