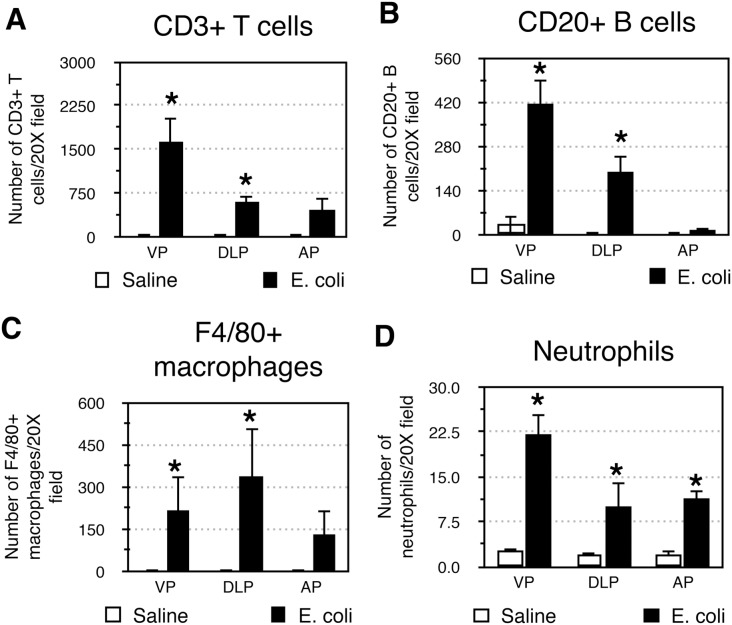
Figure 5. Characterization of inflammatory infiltrate in the inflamed prostate.
Comparisons of the number of CD3+ T cells (A), CD20+ B cells (B), F4/80+ macrophages (C), and neutrophils (D) in the VP, DLP, and AP from saline instilled and E. coli infected mice 28 days post-instillation. n = 4 per group. Data are presented as the mean number of cells per 20X field. *indicates a P-value<0.05 compared to saline control by Wilcoxon rank-sum test. Ventral prostate (VP); Dorsolateral prostate (DLP); Anterior prostate (AP).

