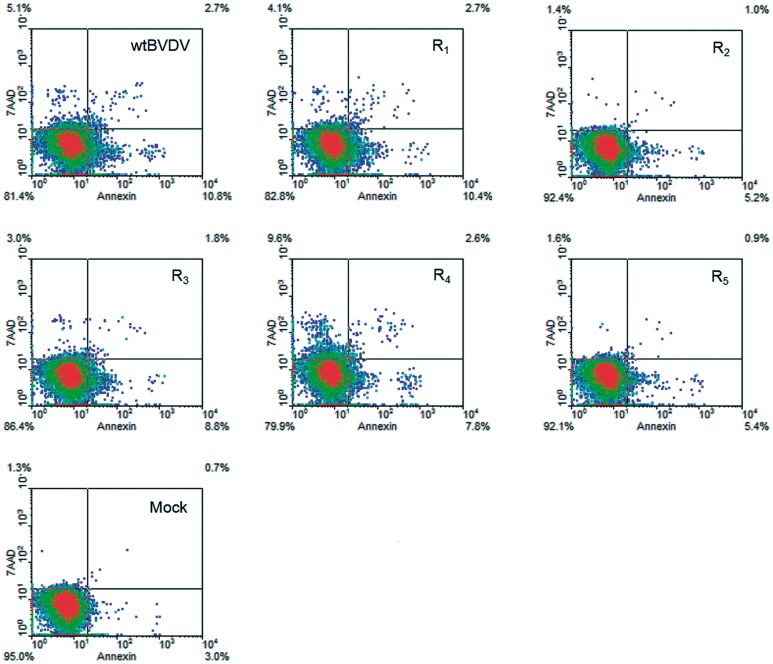
Figure 2. Apoptosis measurements.
MDBK cells were infected with wt BVDV p0 or BVDV R1–5 (MOI 0.01) and at 48 h p.i. apoptotic cells were measured by incorporation of PE Annexin V and 7AAD dyes and analyzed by flow cytometry. Mock-infected cultures were added as control. Representative density plots (20,000 events) obtained with WinMDI software are displayed. Quadrants delimitating positive (pos) and negative (neg) events are shown and the percentage of events in each quadrant is indicated. The populations of PE Annexin V−/7AAD−, PE Annexin V+/7AAD− and PE Annexin V+/7AAD+ correspond to viable cells, early apoptotic cells, and late apoptotic cells.

