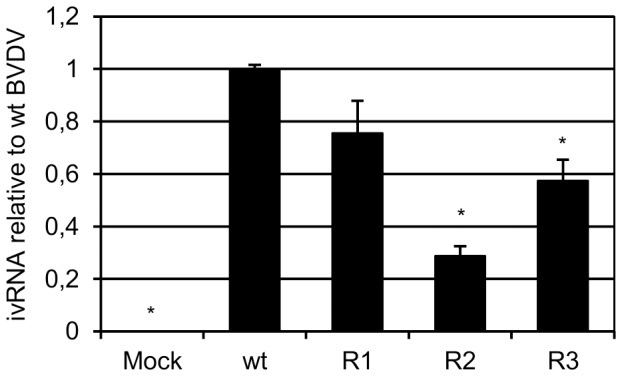
Figure 6. Viral RNA production.

MDBK cells were infected with wt BVDV p0, or BVDV R1, R2 or R3 (MOI 1) and the intracellular viral RNA (ivRNA) was quantified at 24 h p.i. by real-time PCR. For each infection with BVDV R viruses, the results are expressed as ivRNA relative to wt BVDV p0. Mock-infected cells were added as control in each experiment. The results are shown as mean ± SD from two independent experiments in triplicate. *p<0.050; Student's t test vs wt BVDV p0.
