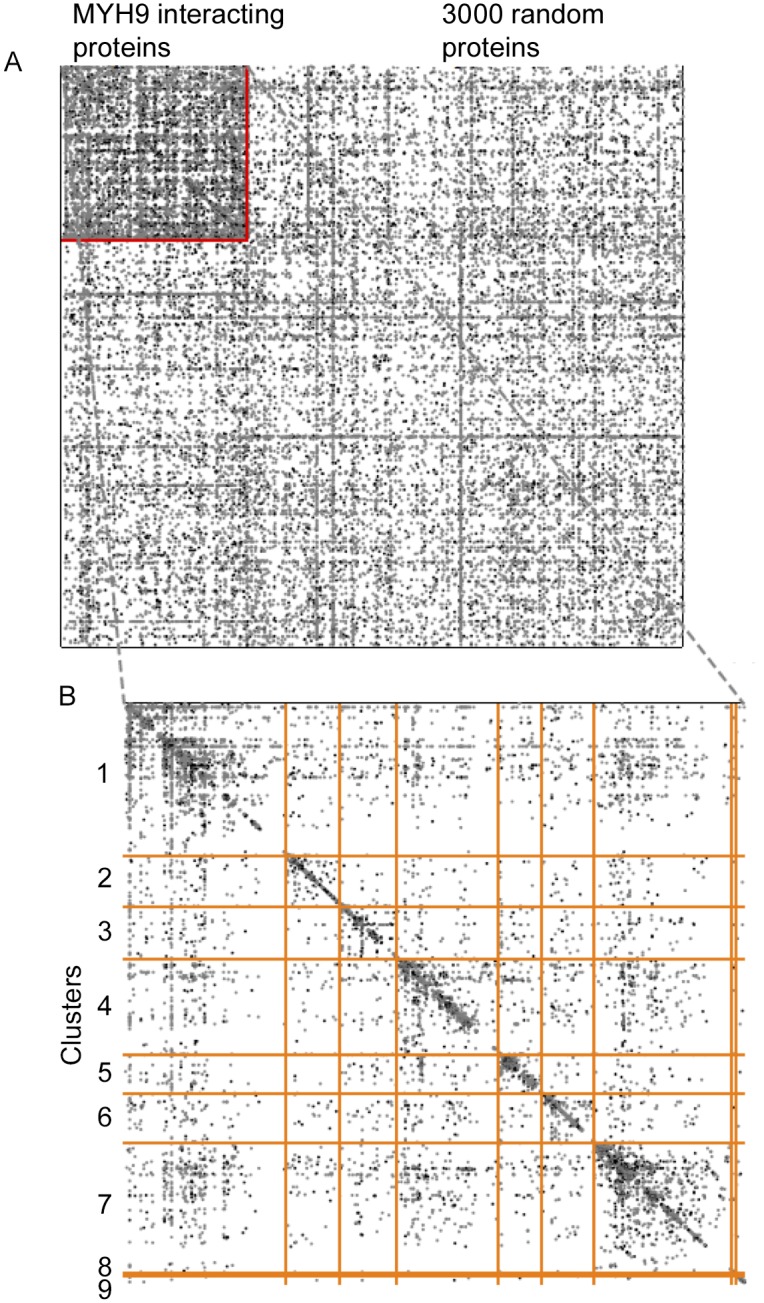
Figure 4. The adjacency matrix of the network of known interactions between the set of MYH9 interacting human proteins, and 3000 random proteins for comparison.

The 623 proteins identified as interacting with MYH9 (in the upper left) along with random set of 3000 random human proteins are plotted along both the x and y axes. Previously described interactions amongst these proteins are depicted as a node at the x, y intersection of a given pair of proteins (A). The increased density of interactions (visually evident as a higher density of nodes in the upper left) within the set of MYH9-interacting proteins indicates that these proteins also belong to previously described complexes. A close-up view is provided which also displays the community structure, with discrete clusters boundaries indicated with orange lines (B). This community structure indicated that nine distinct clusters exist, representing nine distinct groups of proteins with multiple previously described interactions.
