Figure 4.

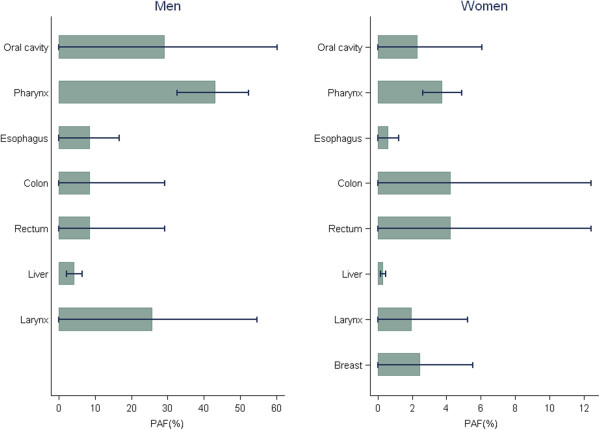
Sensitivity analysis of the PAF for alcohol consumption*. *Lower and upper bounds of 95% CIs for RR estimates used. PAF: population attributable fraction, CI: confidence interval, RR: relative risk.

Sensitivity analysis of the PAF for alcohol consumption*. *Lower and upper bounds of 95% CIs for RR estimates used. PAF: population attributable fraction, CI: confidence interval, RR: relative risk.