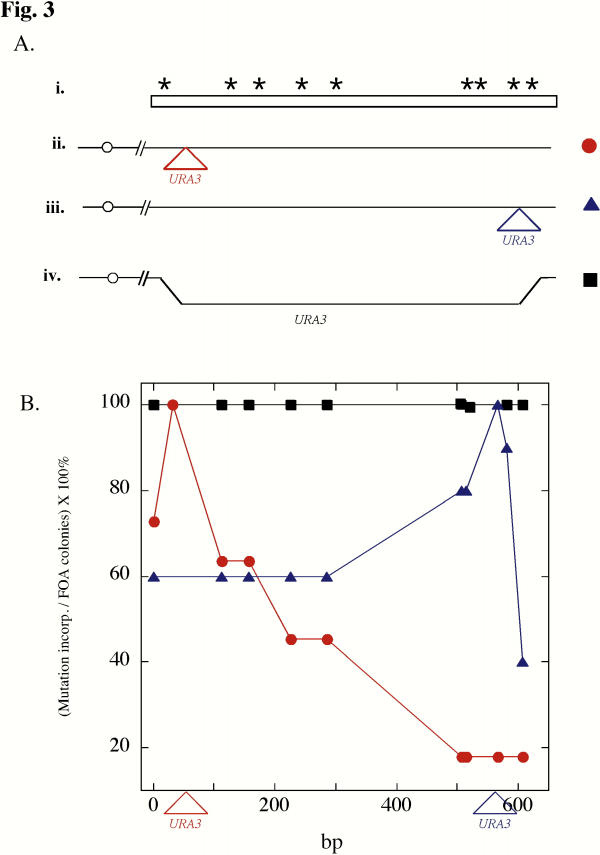
Figure 3.

Incorporation of multiply-mutated PCR fragment. A) Diagram of a multiply-mutated PCR fragment (i) and the chromosomal region of different strains (ii, iii, and iv), each of which contain URA3 integrated at a different position. The approximate sites of each of the nine mutations are represented by asterisks. The site of URA3 insertion in the first two strains is indicated by triangles, and the region replaced by URA3 in the third strain is indicated by a displaced line. The URA3 strains diagrammed in (ii) and (iii) contained a mutation 20 bp from the URA3 insertion that was not present in the PCR fragment, thus there were actually 10 polymorphisms between the PCR fragment and the chromosome. B) The x-axis represents a linear map of the targeted region of the genome. Triangles below the x-axis show the site of the URA3 insertions for strain 1 (red triangle) and strain 2 (blue triangle). The y-axis shows the frequency of incorporation for each mutation after transformation of the strains diagrammed in A (ii–iv) with the PCR fragment diagrammed in A (i). Strain 1, red circles; strain 2, blue triangles; strain 3, black squares).
