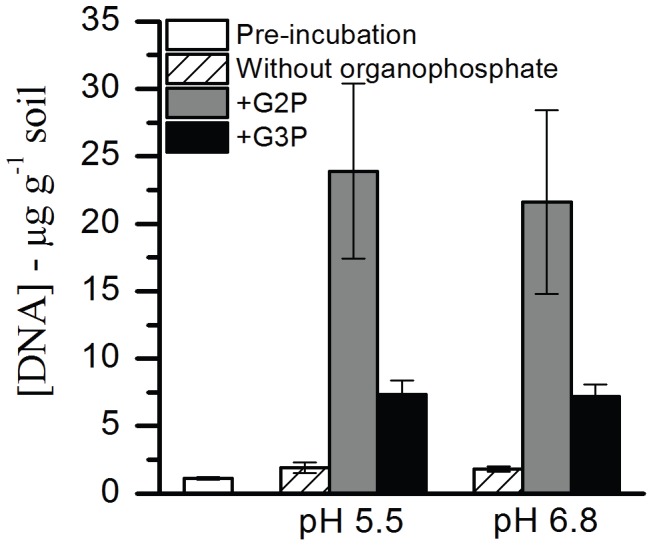
Figure 2. DNA extractions from ORFRC subsurface sediments.

DNA concentrations pre- and post-incubations (pH 5.5 and pH 6.8) amended with G2P, G3P, and without organophosphate. Error bars indicate standard deviation of replicate treatments (n = 3).

DNA concentrations pre- and post-incubations (pH 5.5 and pH 6.8) amended with G2P, G3P, and without organophosphate. Error bars indicate standard deviation of replicate treatments (n = 3).