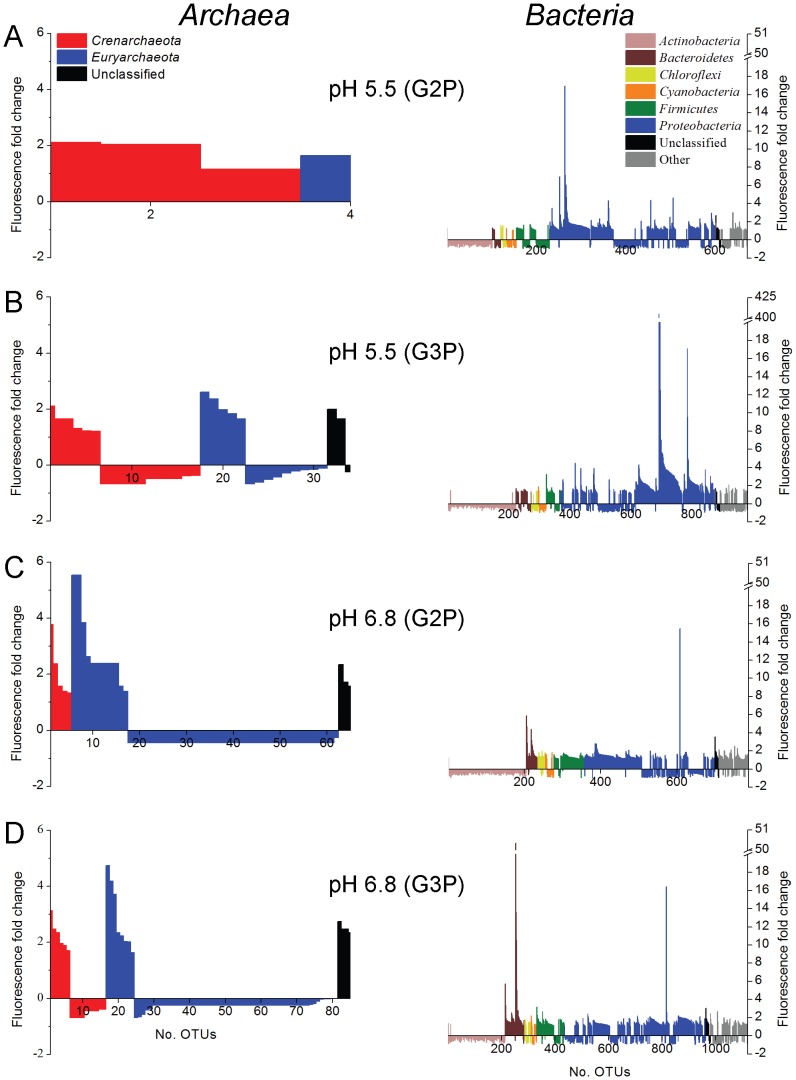
Figure 5. Dynamic archaeal and bacterial OTUs within sediment slurry treatments.
Total detected archaeal (left column) and bacterial (right column) OTUs compiled from replicate treatments that significantly increased or decreased relative to incubations lacking organophosphate. Treatment conditions and total number of taxa plotted: (A) G2P (pH 5.5), (B) G3P (pH 5.5), (C) G2P (pH 6.8), and (D) G3P (pH 6.8). OTUs with a 2-fold or greater decrease in fluorescence were not detected.

