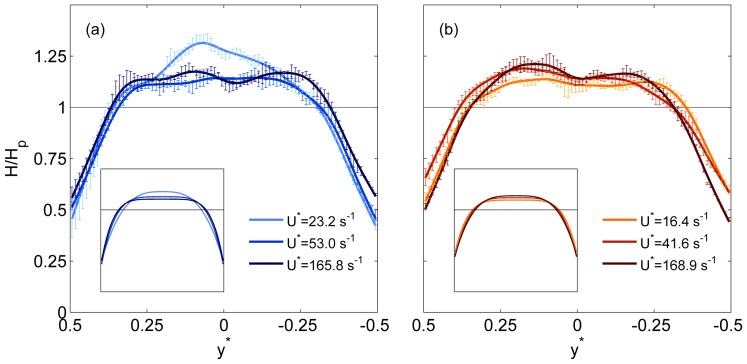
Figure 3. Parent branch haematocrit profiles.
Sample haematocrit profiles in the parent branch for a range of  . Lines show spline fits through the data and error bars show standard deviations. (a) Dextran data (b) PBS data. Uniform haematocrit distribution is indicated by the solid line. Insets show fits to Equation S14: axes on the insets are equal to the main figure.

