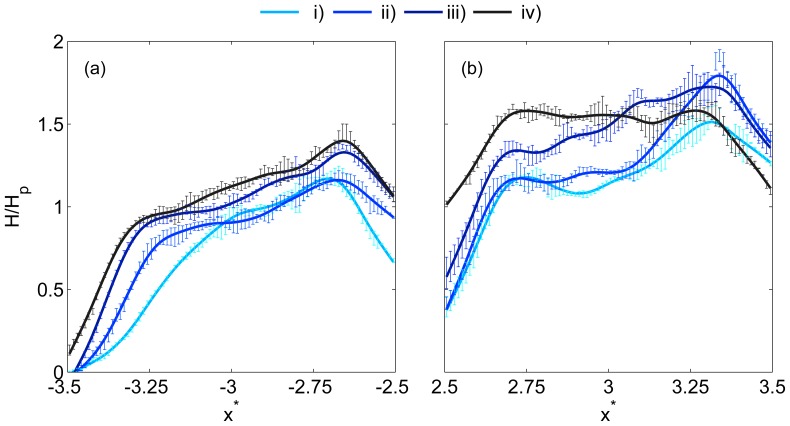
Figure 5. Daughter branch haematocrit profiles.
Sample haematocrit profiles in (a) daughter branch 1 and (b) daughter branch 2. See Table 2 for details of flow ratios. Profiles are indicated with a smoothing spline for clarity and error bars show one standard deviation.

