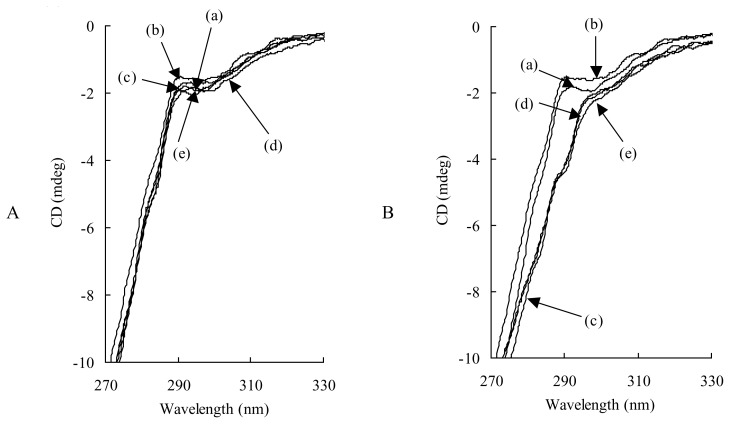
Fig. 7.
CD spectra of 200 μM HSA containing CPA (A) and OLA (B) at several molar ratios in a 0.1 M NaCl buffer solution.
(A) (a) HSA in buffer solution (without NaCl). CPA/HSA molar ratio: (b) 0, (c) 1, (d) 3, (e) 7. (B) (a) HSA in buffer solution (without NaCl). OLA/HSA molar ratio: (b) 0, (c) 1, (d) 2, (e) 7.

