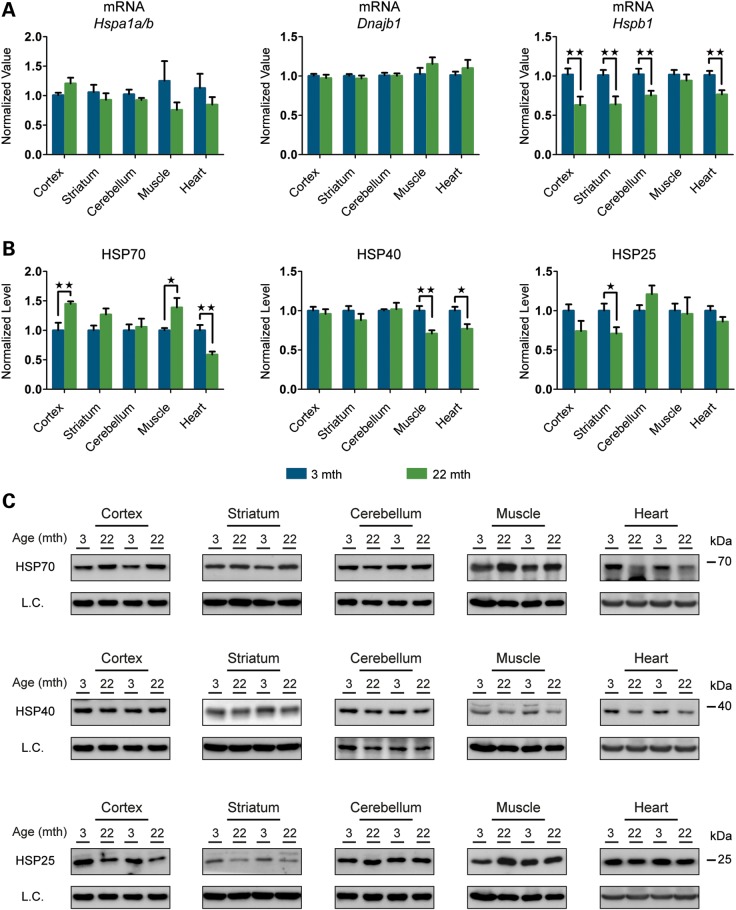
Figure 8.
Basal expression levels of the major HSPs in young and old mice. (A) qPCR analysis of basal expression levels of Hspa1a/b, Hspb1 and Dnajb1 in brain regions and peripheral tissues from mice at 22 months of age when compared with 3 months (n = 8/age). (B) Relative basal levels of HSPs in brain regions and peripheral tissues of mice at 22 months of age when compared with 3 months (n = 7/age). (C) Representative western blots used for the quantification in (B). Data are the mean ± SEM. *P < 0.05; **P < 0.01. Asterisk indicates the statistically significant difference in the level of induction. Muscle, quadriceps; L.C., loading control; mth, months.

