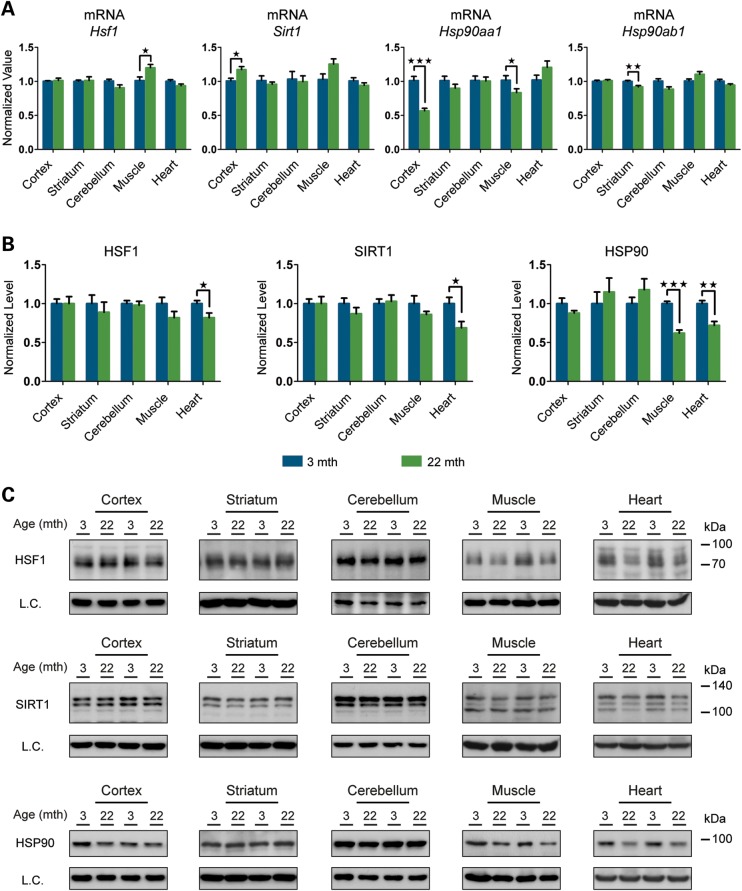
Figure 9.
Basal expression levels of the major HSR regulators in young and old mice. (A) qPCR analysis of basal expression levels of Hsf1, Sirt1, Hsp90aa1 and Hsp90ab1 in brain regions and peripheral tissues from mice at 22 months of age when compared with 3 months (n = 8/age). (B) Relative basal protein levels of HS regulators in brain regions and peripheral tissues of mice at 22 months of age when compared with 3 months (n = 7/age). (C) Representative western blots used for the quantification in (B). Data are the mean ± SEM. *P < 0.05; **P < 0.01; ***P < 0.001. Asterisk indicates the statistically significant difference in the level of induction. Muscle, quadriceps; L.C., loading control; mth, months.

