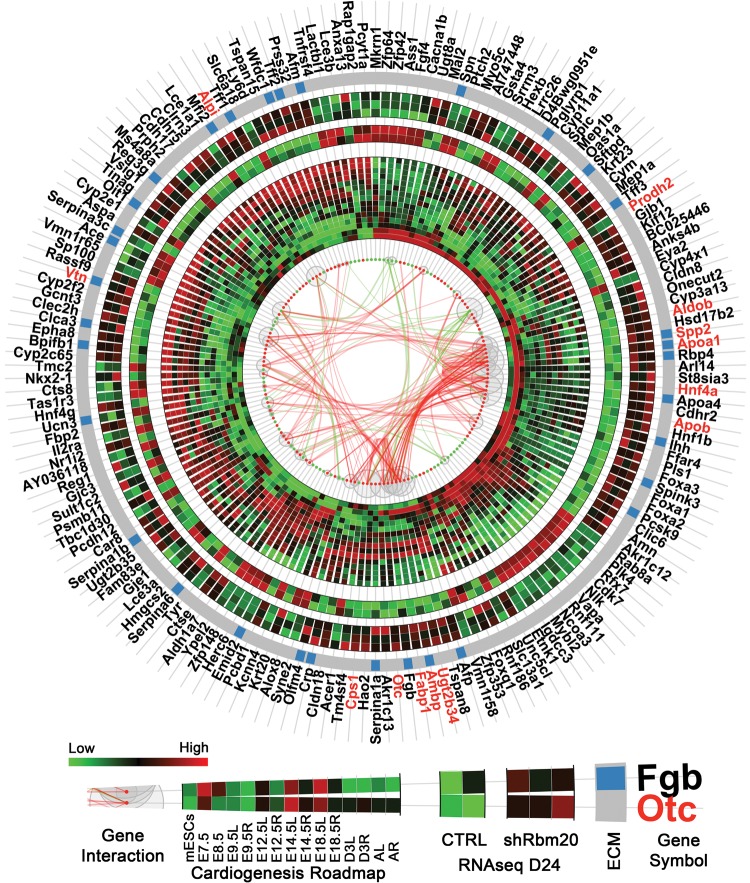
Figure 6.
Rbm20-deficient EBs at d24 revealed dysregulation of gene expression patterns in extracellular matrix networks. Circular plot showed gene interactions, expression patterns in natural cardiogenesis (time-course microarray) and in control and shRbm20-derived cardiomyocytes at Day 24 (RNAseq). Differentially expressed genes are represented by red (up-regulated) and green (down-regulated) dots with curves in the center linking them and representing the interactions between genes (green: interaction connecting to down-regulated genes; red: interaction between up-regulated genes only). The sizes of the gray bubbles surrounding the red and green dots correspond to the numbers of interactions for each gene (i.e. larger bubbles represent more interactions). The inner heatmap represents the expression profiles during natural cardiogenesis. Natural cardiogenesis is characterized by time-course microarray experiment at nine different developmental stages using a mouse model including mESCs, E7.5, E8.5, E9.5, E12.5, E14.5, E18.5, 3 days after birth (D3) and adult (A) stages, starting from E9.5, the heart was dissected by left (L) and right (R) ventricles. At each time point, the heatmap showed the average expression of biological triplicate. The middle heatmap is for the two control samples in RNAseq and outer heatmap for three shRbm20-derived samples. Genes belonging to the ECM are indicated by blue bars on the gray circular band. The names of hub genes in the interaction network with more than 10 interactions are labeled in red.

