
Figure 4.
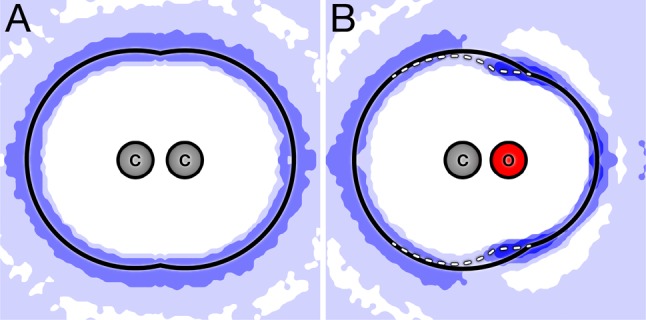
Maps of the water–oxygen density around (A) weakly charged and (B) strongly charged diatomic solutes. The blue contours indicate water density greater than the bulk value, with the darker blue regions indicating the enhanced water probability density. The black line shows the nonadaptive fixed rw boundary. For the weakly charged diatomic, the adaptive and nonadaptive boundaries coincide. The white line shows the adaptive boundary. For the charged diatomic, the adaptive and nonadaptive boundaries differ.