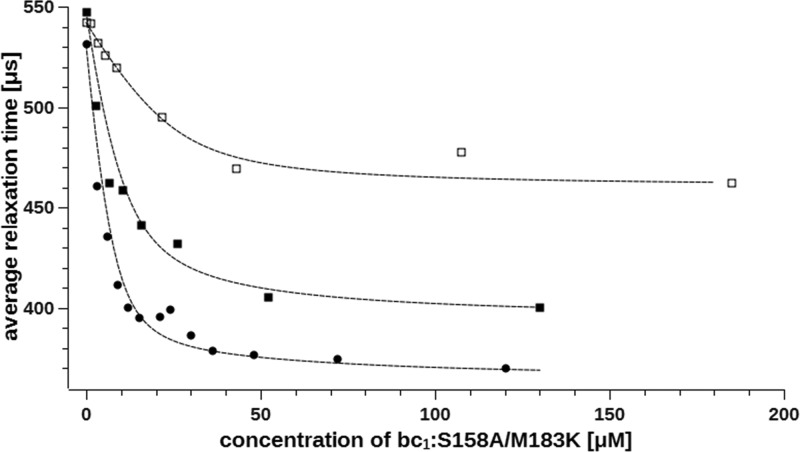
Figure 5.
Titration of 25 μM cytochrome c2 A101C-SL with cytochrome bc1 at different ionic strengths. Binding of cytochrome c2 to cytochrome bc1 mutant M183K/S158A was monitored as changes in average spin–lattice relaxation time. Measurements were performed for solutions containing 0 mM NaCl (circles), 10 mM NaCl (solid squares), and 25 mM NaCl (open squares) at 95 K. Dashed lines represent fits of eq 1 in which na was substituted with eq 2.

