
Figure 3.
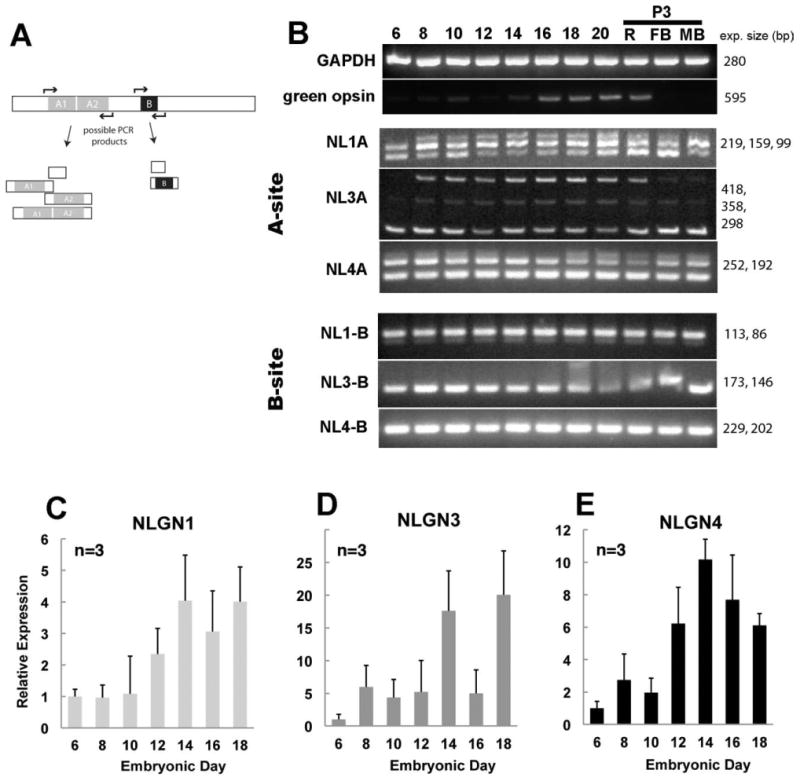
Alternatively spliced neuroligin family members expressed during retinal development and relative abundance of gene expression. A: PCR primers flanking each of the conserved splice sites (sites A and B) for NLGN were used to detect NLGN isoform variation and give rise to several combinations of transcript variants. B: PCR amplification of cDNAs from a developmental time course of retinal tissues was separated by gel electrophoresis. C–E: Quantitative real-time PCR shows the relative abundance of NLGN1 (C), NLGN3 (D), and NLGN4 (E) transcripts in relation to the GAPDH housekeeping control gene. Error bars represent standard deviation (n = 3).