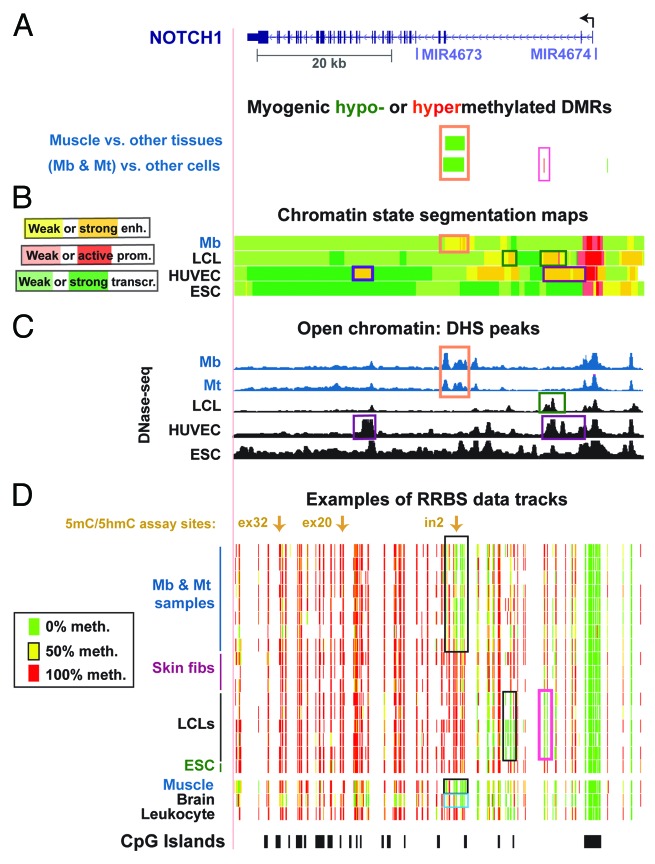
Figure 1. Myogenesis-associated hypomethylation and chromatin epigenetic marks in NOTCH1 intron 2: whole-gene view. (A) Significantly hypomethylated (green) or hypermethylated (red) DMRs for the set of Mb +Mt samples vs. 16 types of nonmuscle cell cultures and for skeletal muscle vs. 14 types of nonmuscle tissue. Wide green bars, the DMR encompassing MbMt- or muscle-hypomethylated CpG sites. (B)The predicted chromatin structure (enh, enhancer; prom, promoter; transcr, transcriptionally active) based mostly on histone modifications.57 (C) DNaseI-hypersensitivity mapping by DNaseI-seq.22 (D) Examples of RRBS data and the positions of CpG islands. Using an 11-color, semicontinuous scale (see color guide), the RRBS tracks indicate the average DNA methylation levels at each monitored CpG site from the quantitative sequencing data.22,28 The RRBS data are shown for four independent Mb cultures and for Mt preparations derived from them, three skin or foreskin fibroblast cultures, five independent LCLs, H1 ESC, skeletal muscle, brain, and leukocytes, as described previously.22 The orange boxes in (A–C) indicate overlapping epigenetic features and other boxes indicate other noteworthy epigenetic features. All tracks are aligned. The chr9:139,386,830–139,447,728 (hg19) region is shown. Mt exhibited histone modifications patterns similar to Mb in the regions shown in this figure and in those of subsequent figures (not shown). See Figure S1 for a close-up of the myogenic DMR and its features that cannot be seen well in this whole-gene view.

An official website of the United States government
Here's how you know
Official websites use .gov
A
.gov website belongs to an official
government organization in the United States.
Secure .gov websites use HTTPS
A lock (
) or https:// means you've safely
connected to the .gov website. Share sensitive
information only on official, secure websites.
