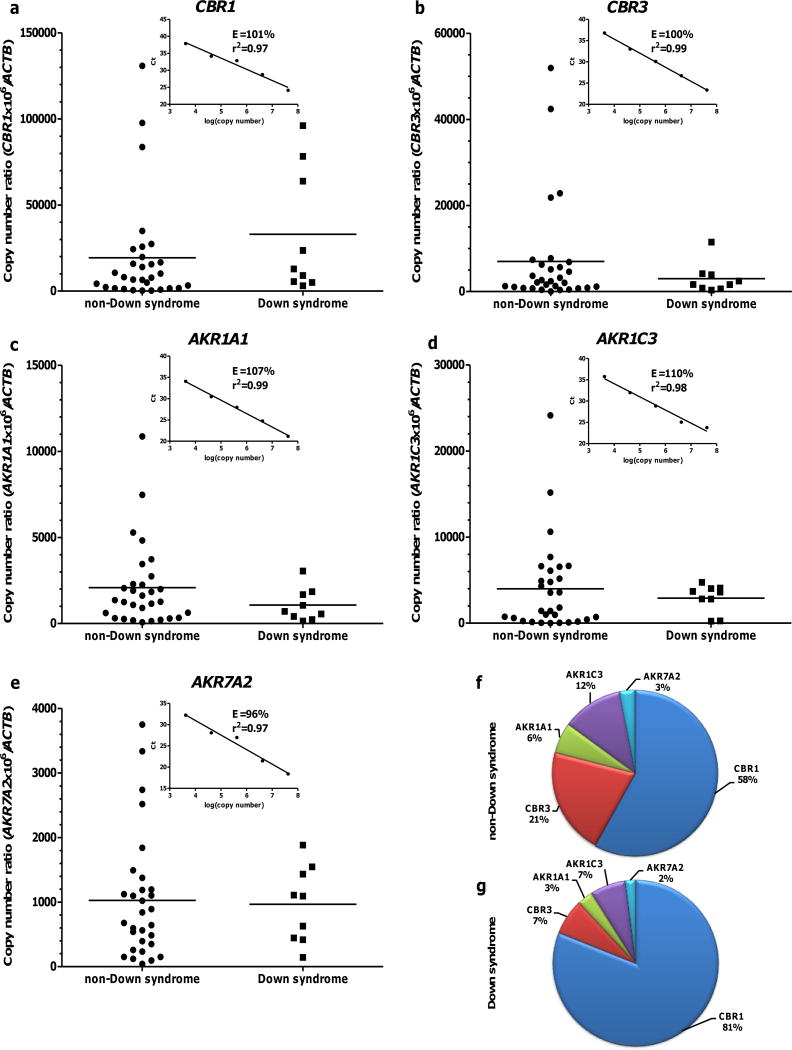
Fig. 1.
Cardiac CBR1, CBR3, AKR1A1, AKR1C3, and AKR7A2 mRNA expression in samples from donors with- (n = 9) and without- DS (n = 30) (Panels: a – e). Each symbol depicts the average of individual samples. Horizontal lines indicate group means. Insets show the corresponding calibration curves. Samples and standards for calibration curves were analyzed in triplicates. Relative abundance of cardiac CBRs and AKRs mRNAs in donors without- (f) and with- DS (g).

