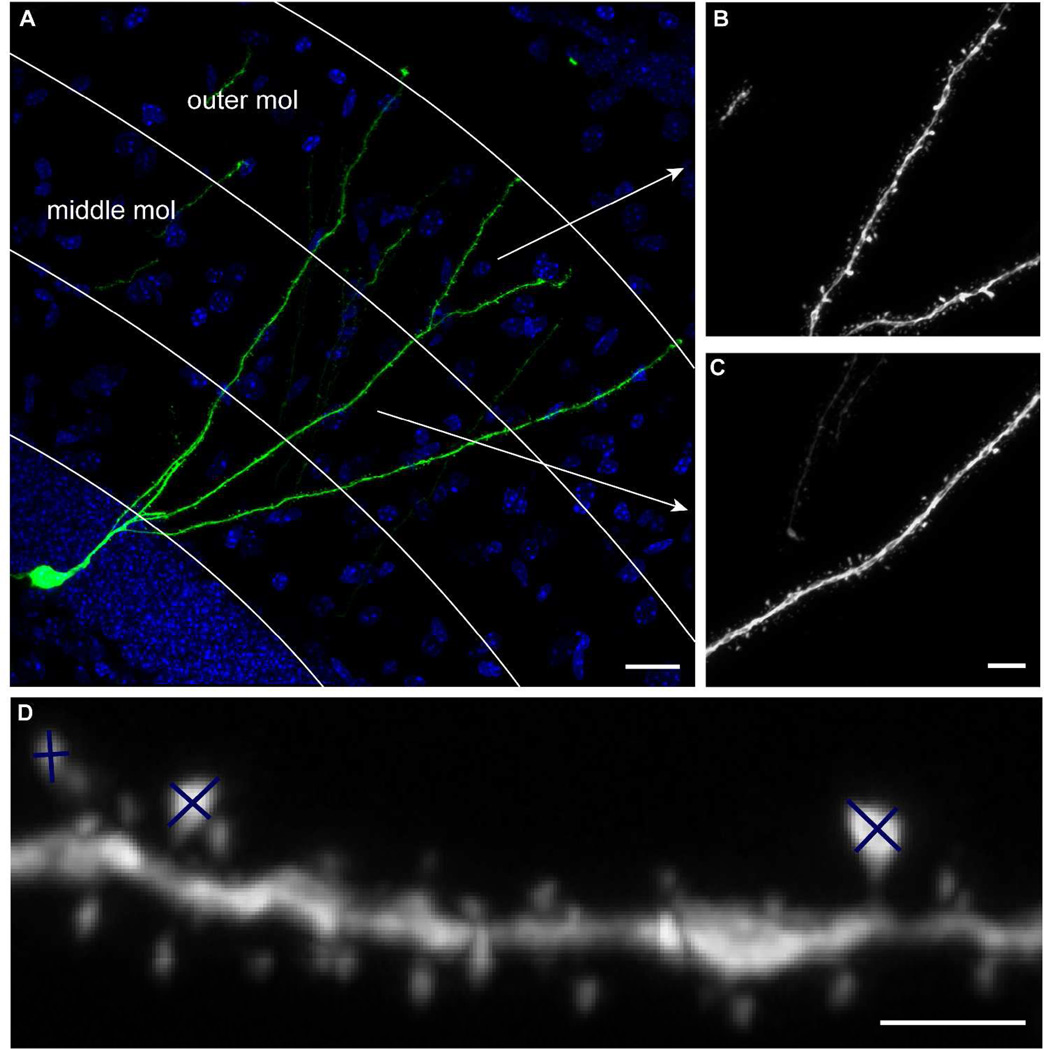
Figure 1. Data acquisition and analyses.
(A) Sample image of newborn GC labeled by retrovirus CAG-GFP at 8 weeks post virus injection. Arrows indicate the dendritic processes shown in B and C. (B) Sample image of dendritic processes in the outer molecular layer (mol). (C) Sample image of dendritic processes in the middle molecular layer. (D) Examples of spines whose sizes were estimated by measuring the major and minor axes of the spine heads.. Scale bars =20 µm (A), 5 µm (B and C), 2 µm (D).

