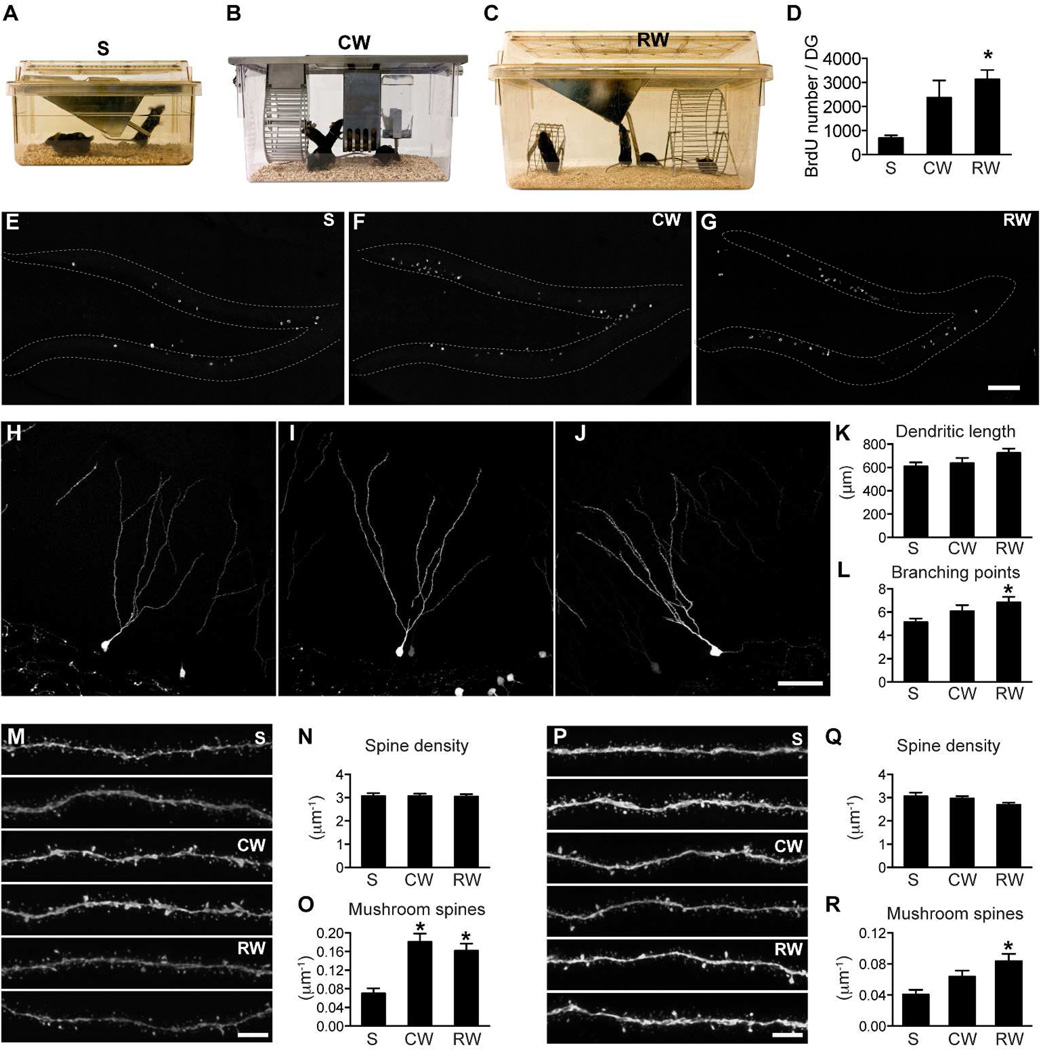
Figure 2. Spine maturation in the outer and middle molecular layers is differentially regulated.
(A) Standard mouse static cage - S. (B) Mouse single activity wheel chamber - CW. (C) Rat cage with a big and a small running wheel – RW. (D) Quantification of BrdU cell number confirmed that running increased hippocampal neurogenesis. BrdU cell number was significantly higher in the RW group than in the S group (*: p<0.05). (E–G) Sample images of BrdU labeling in the DG in mice housed in S (E), CW (F) and RW cages (G). (H–J) Representative images of newborn GCs from mice housed in cages S, CW and RW, respectively. (K) New neurons did not differ significantly in total dendritic length between groups. (L) New neurons in the RW group had more dendritic branching points than those in the S group (*: p<0.05). For H–I, n=35, 30 and 25, respectively, for S, CW and RW. (M) Representative images of newborn GC dendritic processes in the outer molecular layer (2 each for S, CW and RW). (N) Total spine density of new neurons did not differ between groups in the outer molecular layer. (O) Mushroom spine density was significantly increased in both the CW and RW groups in the outer molecular layer (*: p<0.01). For N–O, n=34, 55 and 48 for S, CW and RW, respectively. (P) Representative images of newborn GC dendritic processes in the middle molecular layer (2 each for S, CW and RW). (Q) Total spine density of new neurons did not differ between groups in the middle molecular layer. (R) Mushroom spine density was specifically increased in the RW group in the middle molecular layer (*: p<0.01). For Q–R, n=38, 54 and 45, respectively for S, CW and RW. Scale bars: 100 µm (E–G), 50 µm (H–J) and 5 µm (M,P).

