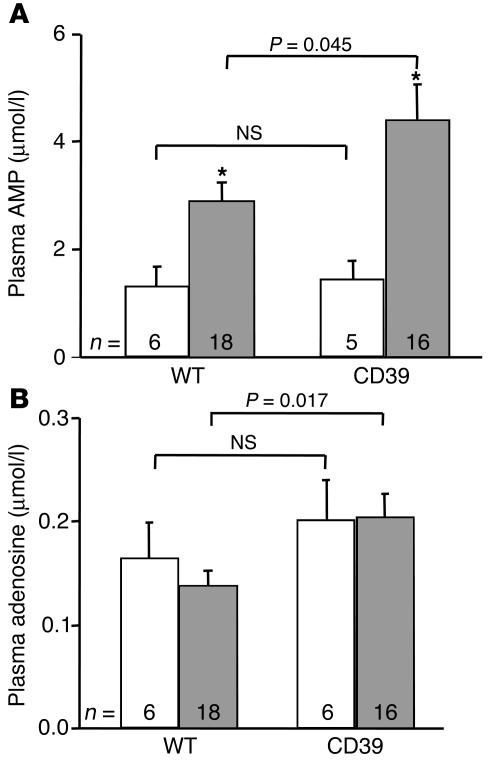
Figure 4.
Expression of hCD39 elevates plasma adenosine and AMP levels. (A) The level of AMP is significantly higher (*P < 0.01 compared with basal) in both WT and hCD39 transgenic mice following challenge with collagen (gray bars) as compared with basal levels (white bars), but the increase in transgenic mice is significantly greater than that observed in the WT mice. (B) Basal (white bars) adenosine levels are comparable between WT and transgenic mice, but following collagen injection (gray bars) the level of adenosine in the transgenic mice is significantly higher.

