
Fig. 10. Summary: Quantitation of cytochrome C release from mitochondria of WT and DKO MEF during C12 treatment.
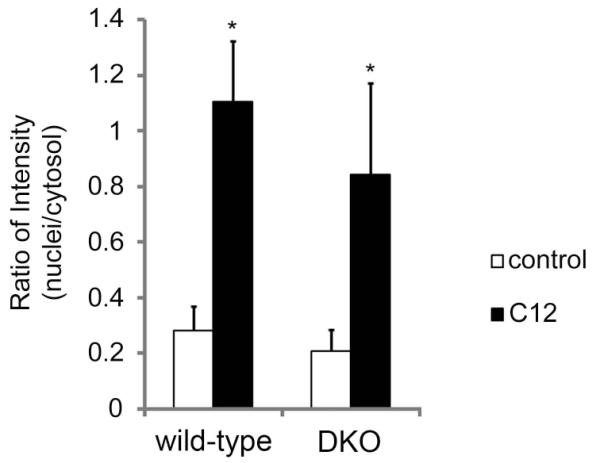
Average of nuclear/cytosol cytochrome C in control vs. C12-treated WT and DKO MEF. Compared to controls, there were C12-induced increases in nucleus/cytosol ratio for cytochrome C in WT and DKO MEF. Data are averages-/+SD for n = 10 cells from one field on one slide; *p<0.05 for comparison C12 vs. control. Results are typical for cells in 3 experiments.