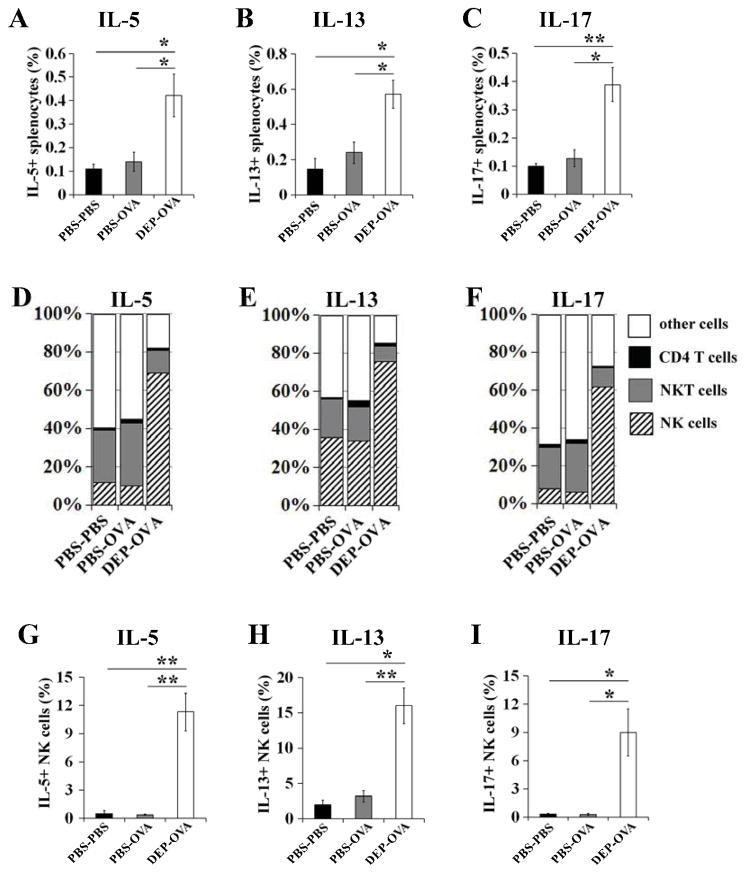
Figure 5. Cytokine expression in splenocyte populations.
OVA-stimulated and immunostained splenocytes (CD3, CD4, NK1.1, NKp46 and a cytokine) from PBS-PBS, PBS-OVA, and DEP-OVA mice were analyzed by flow cytometry. CD4 T cells, NK and NKT cells were defined as CD3+CD4+NK1.1−NKp46−, CD3−NK1.1+NKp46+ and CD3+NK1.1+ cells, respectively. A–C, Cytokine+ splenocytes expressed as a percentage of all splenocytes. D–F, Percentages of cytokine+ cells attributable to individual cell populations. G–I, Cytokine+ NK cells expressed as a percentage of all NK cells; mean values (± SEM) shown from 6 mice/group

