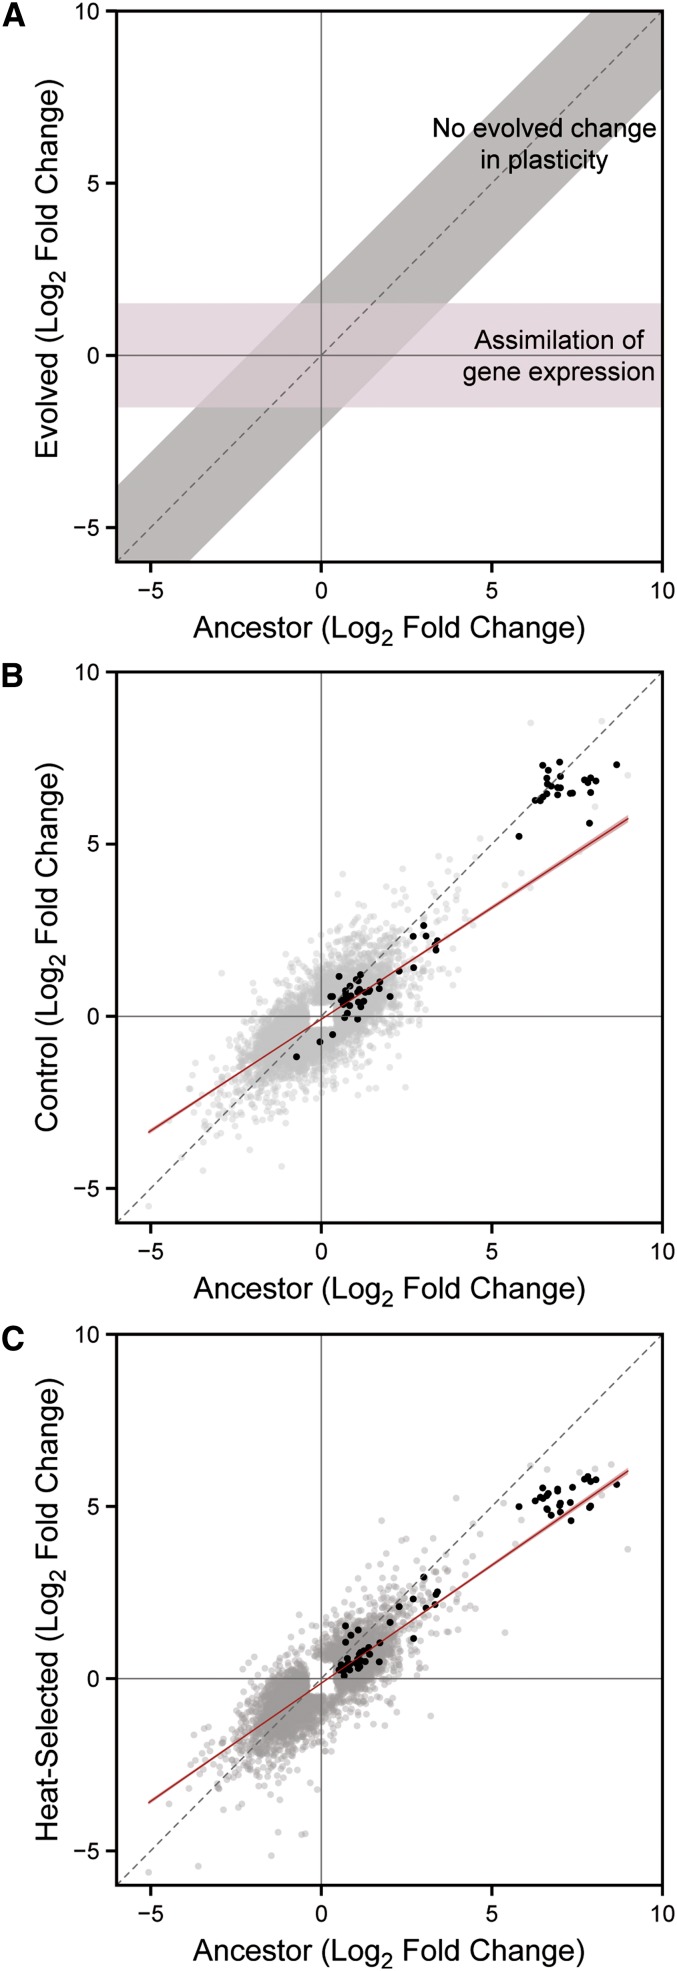
Figure 2.
Inducible transcriptional response in evolved lines of C. remanei. (A) Predicted changes in transcriptional plasticity between the ancestor and heat-evolved populations under a null hypothesis in which genes have equivalent levels of plasticity in both selection lines (i.e., no change in plasticity) or the alternative hypothesis in which there is genetic assimilation of gene expression in the evolved line. (B) Comparison of changes in inducibility of gene expression at 30° in ancestor vs. the control evolved populations or (C) ancestor vs. heat-selected. Gray points represent differentially expressed genes from either of the compared lines, and black points represent candidate hsp genes. Red lines in (B) and (C) indicate the linear fit from the regression model (±95% CI). Gray dashed line is slope of 1, representing the null hypothesis of equal expression between lines.

