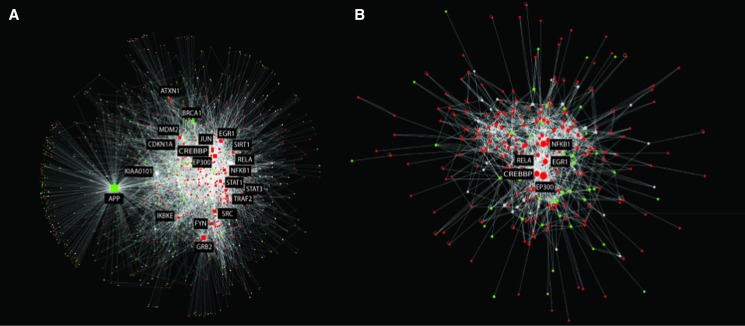
Figure 5.
Network analysis of differentially expressed (DE) genes. InnateDB was used to generate a network of experimentally supported molecular interactions that have been annotated to occur directly between the DE genes and their encoded products. (A) The top 20 CytoHubba-predicted network hubs and their interactors. Overlain on the network is gene expression data from MIMs at 36 hpi (red = upregulated; green = downregulated). The top 20 hubs were highly enriched for roles in innate immunity. (B) The high-scoring DE subnetwork identified in the larger network using jActiveModules. This module was highly enriched for several innate immune relevant pathways.

