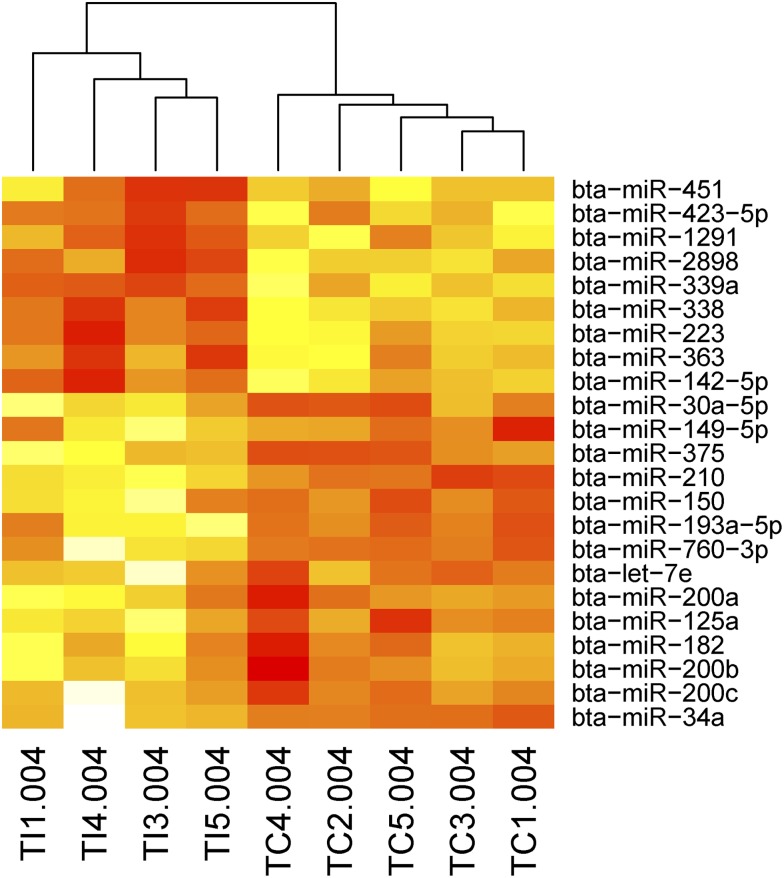
Figure 6.
A heatmap of the normalized read counts of miRNAs that were identified as differentially expressed in MIMs at 36 hpi. Hierarchical clustering revealed the separation of the infected and control animals based on this miRNA expression data (more red the colour the more highly expressed the miRNA is). Note that one infected animal (TI2) is not included in this analysis because it did not appear to respond to the infection as measured by CFU or mRNA expression data (see Figure 2).

