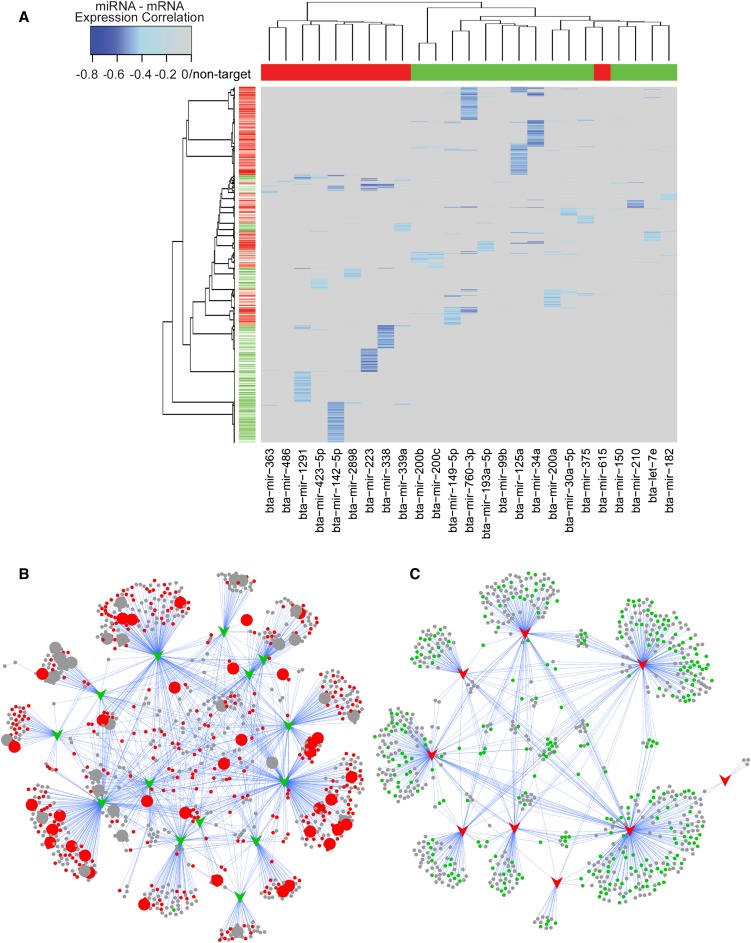
Figure 7.
Visualization of miRNA targets. (A) Two-dimensional cluster analysis and heatmap visualization of the miRNA/mRNA expression correlation data matrix after filtering by predicted miRNA-targets and correlation significance. The primary split in the upper hierarchical dendrogram largely aligns with the upregulated miRNA (red) and downregulated miRNA (green). miRNA/mRNA target expression correlations are colored based on increasing significance (light blue to blue) with nontarget/nonsignificant correlations masked (gray). (B) A network representation of the predicted targets (circular nodes) of downregulated miRNAs (green arrows). Red circles = upregulated in MIM mRNA expression data at 36 and/or 48 hpi. Larger circular nodes represent those genes that have been annotated by InnateDB to have a role in innate immunity. (C) A network representation of the predicted targets (circular nodes) of upregulated miRNAs (red arrows). Green circles = downregulated in MIM mRNA expression data at 36 and/or 48 hpi. Note that the predicted targets of downregulated but not upregulated miRNAs are highly enriched for roles in innate immunity.

