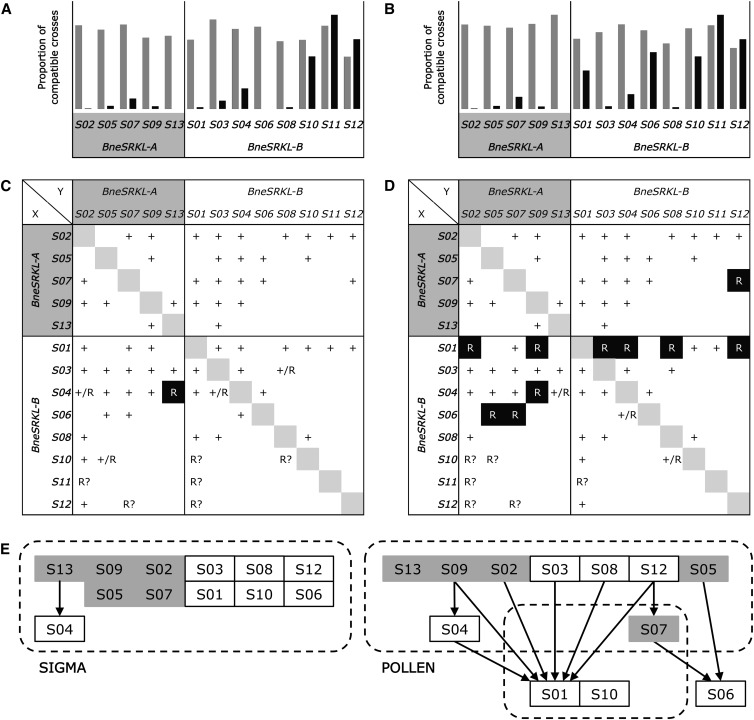
Figure 4.
Dominance relationships determined by controlled pollinations between 13 S-haplotypes in B. neustriaca. Proportion of successful pollinations calculated for all crosses involving stigma (A) or pollen (B) of an individual with a given S-haplotype (x-axis). Crosses between individuals sharing or not sharing the haplotype are filled in black and gray, respectively. Pattern of SI expression for S-haplotypes involved in 35 possible genotypes in stigma (C) and pollen (D). Results are indicated for the haplotype X (in rows) as compared to haplotype Y (in columns) and report whether X was expressed (+) or not (R). Uncertain cases resulted from either the lack of evidence for X function (R?) or from inconsistencies between different individuals with the same genotype (+/R). (E) Dominance relationships among 12 S-haplotypes (S11 removed) in stigma (left) and pollen (right). Only nonambiguous cases were reported here. Dotted frames regroup haplotypes that are mostly codominant. Arrows indicate dominance relationships. Haplotypes from classes A and B are filed in gray and white respectively. See Figure 3, Figure S1, Figure S2, Figure S3, Figure S4, Figure S5, Figure S6, Figure S7, Figure S8, Figure S9, Figure S10, Figure S11, Figure S12, Figure S13, and Figure S14 for detailed crosses.

