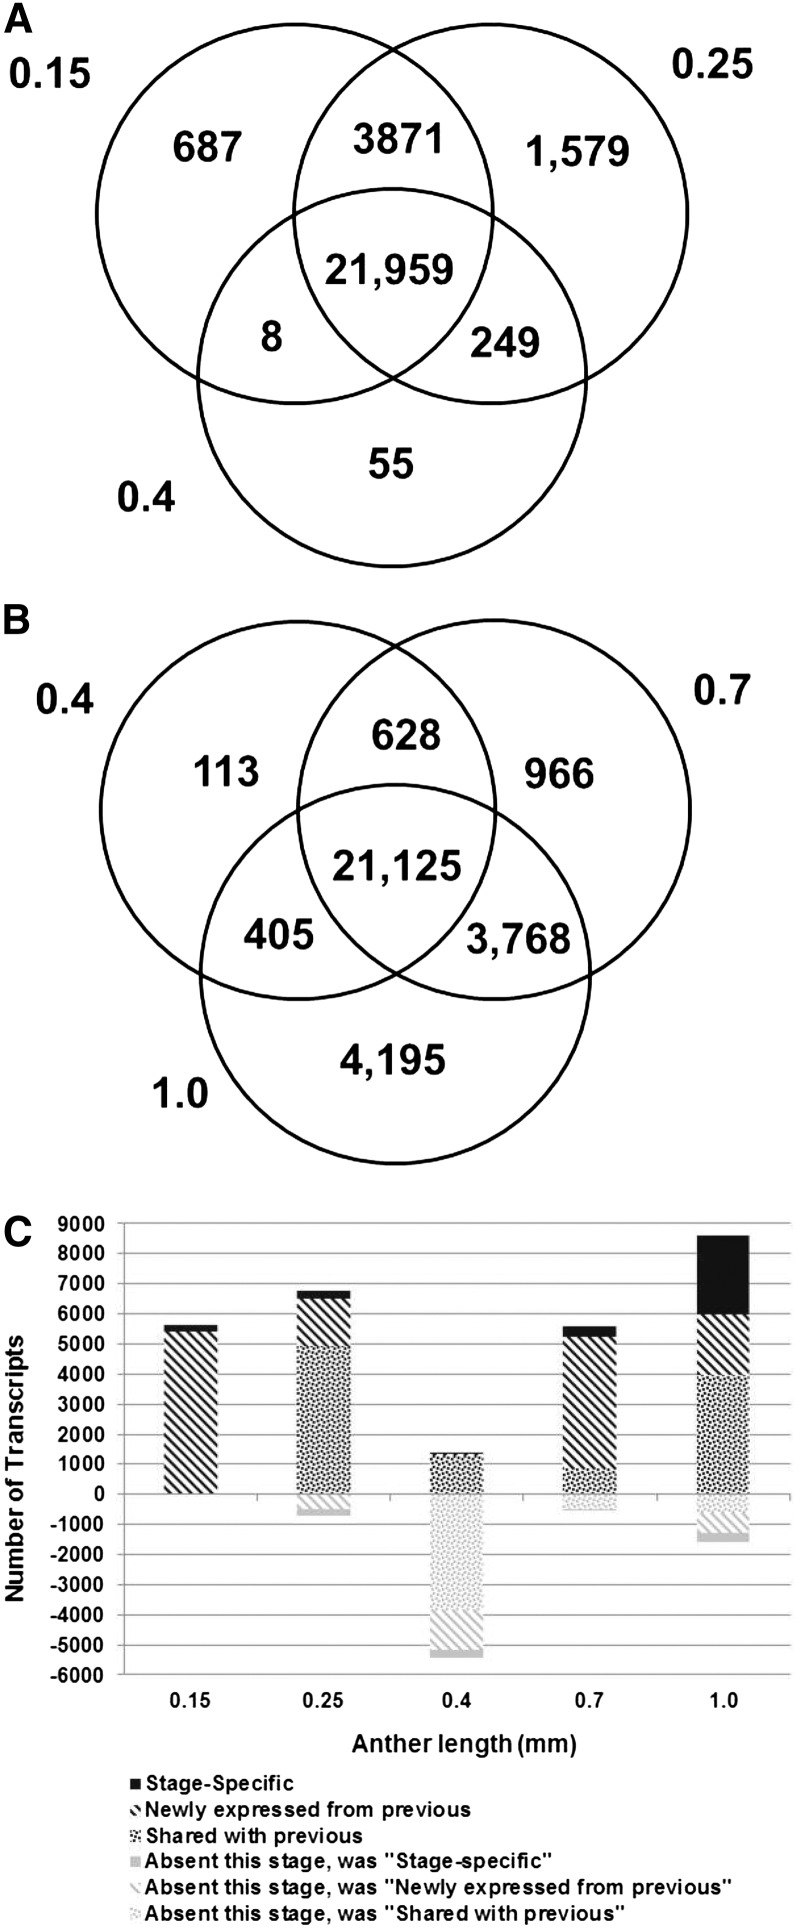
Figure 2.
Major patterns of transcript expression in immature maize anthers. (A) Overlap of ON expression between stages 0.15 mm, 0.25 mm, and 0.4 mm. (B) Overlap of ON expression between stages 0.4 mm, 0.7 mm, and 1.0 mm. (C) Graphical analysis of transcript gain and loss from the 0.15 mm to 1 mm stage. Counts above zero represent transcripts present in that stage classified by their relation to the previous stage (newly expressed or shared with previous stage), but stage-specific transcripts are separately categorized. Counts below zero indicate transcripts that were present in the previous stage but were not detected in the current stage. The previous category of these transcripts is also indicated by the similar but lighter color pattern.

