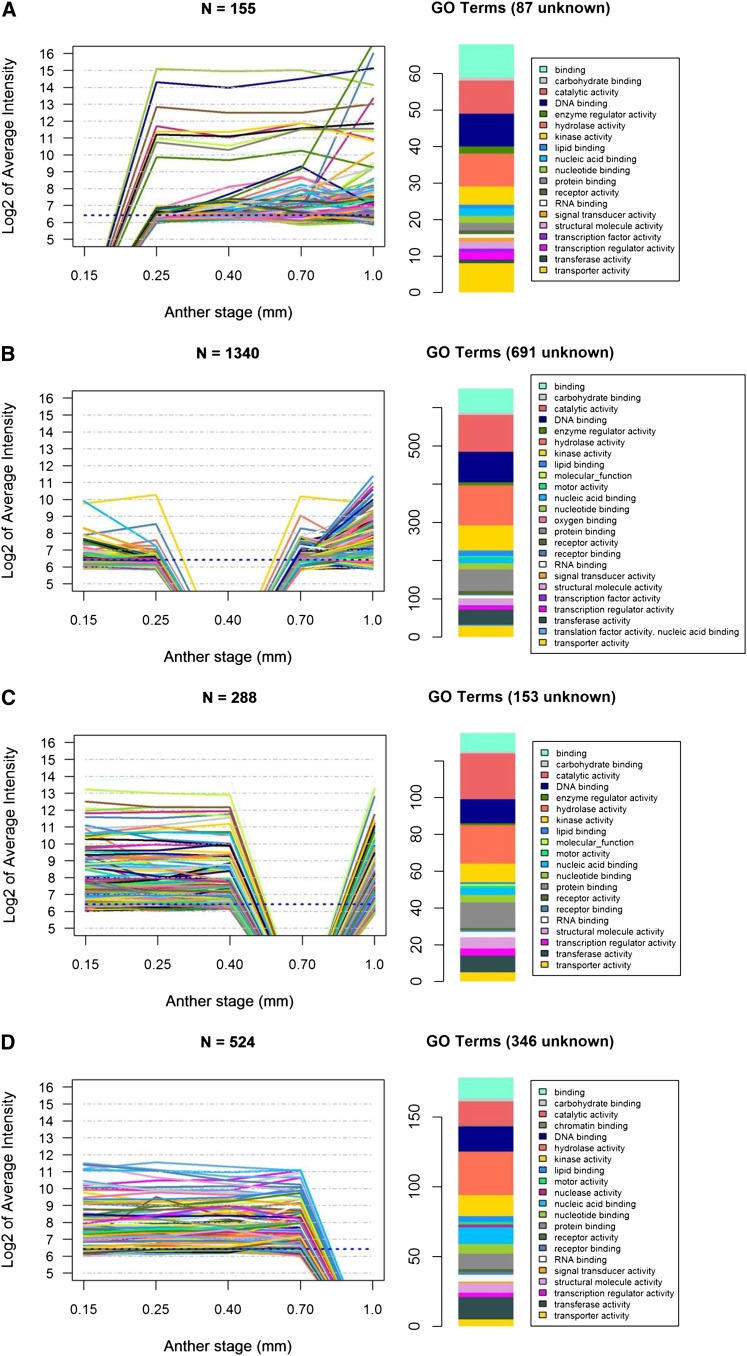
Figure 3.
Microarray intensities for four clusters of genes with detectable transcript in all but one stage. Clusters of transcripts shown are those not detected only at 0.15 mm (A), 0.4 mm (B), 0.7 mm (C), or 1.0 mm (D). To the right of each expression pattern is a histogram of the GO term counts associated with the transcripts after removal of any transcripts lacking GO terms.

