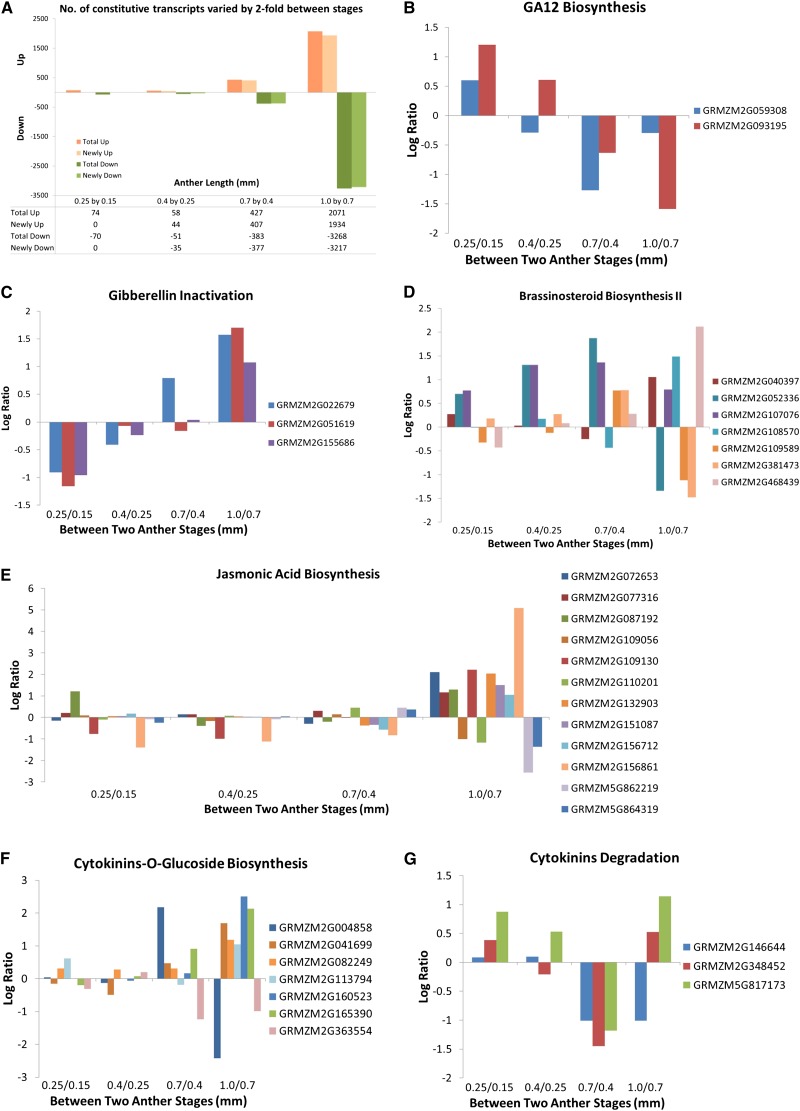
Figure 5.
Pathway analysis of constitutive transcripts that are differentially regulated with the significance set at two-fold of normalized average intensities. (A) Number of differentially regulated transcripts compared between two consecutive anther stages: UP, increased by two-fold from the previous stage, and DOWN, decreased by two-fold from previous stage. Newly indicates not found in the previous stage. (B–G) Log2 ratio of differentially expressed transcripts in GA12 biosynthesis (B), gibberellin inactivation (C), brassinosteroid biosynthesis II (D), jasmonic acid biosynthesis (E), cytokinin-glucoside biosynthesis (F), and cytokinin degradation (G) pathways.

