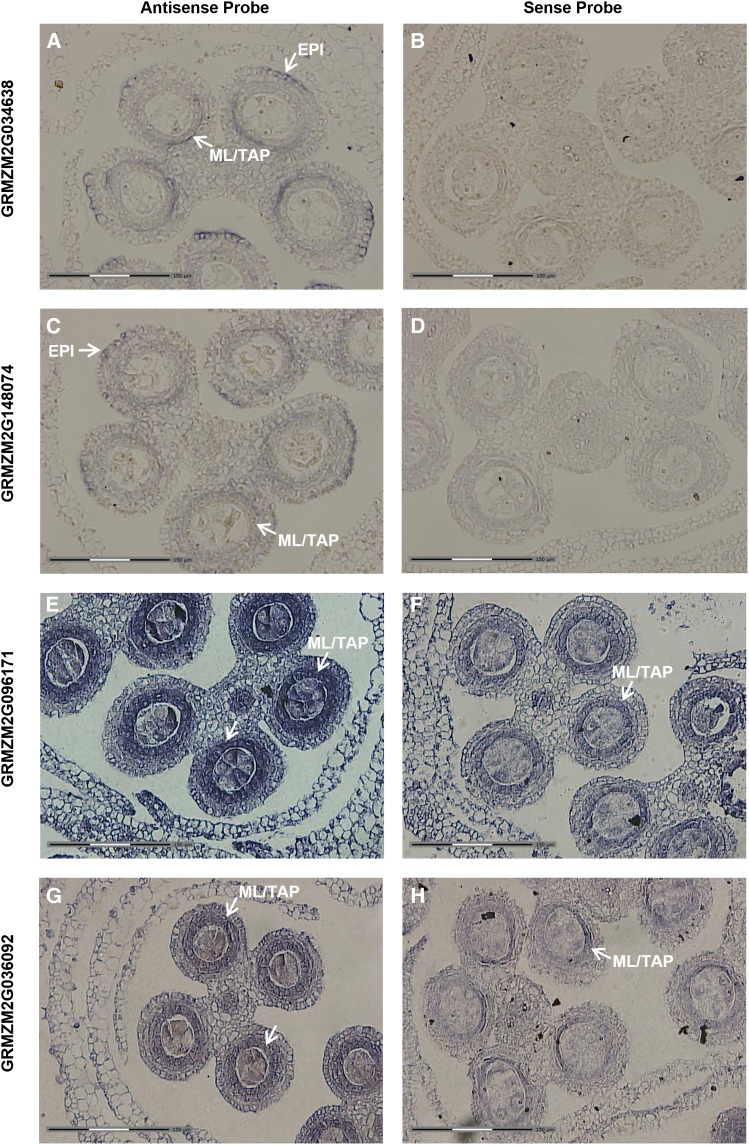
Figure 8.
In situ candidates for cell-enriched markers. Genes were chosen for in situ analysis to verify patterns selected as somatic-specific in the 0.7 mm laser-microdissected data set. Antisense probes (A, C, E, G) for each gene and the corresponding sense probes (B, D, F, H) are shown. As predicted, all genes showed significant enrichment in the somatic cells in lobes of anthers ≥0.7 mm. (A, B) GRMZM2G034638, a predicted EDG-6 sphingosine 1-phosphate receptor. (C, D) GRMZM2G148074, an HD-ZIP protein with predicted DNA binding and transcription regulator activity. (E, F) GRMZM2G096171, a CheY-like protein with predicted signal transducer and transcription regulator activity. (G, H) GRMZM2G036092, a predicted DNA binding protein with transcription regulator activity. White arrows point to cell types where the signal is detected. The white section of the scale bars in the lower left of each panel corresponds to 150 µm.

