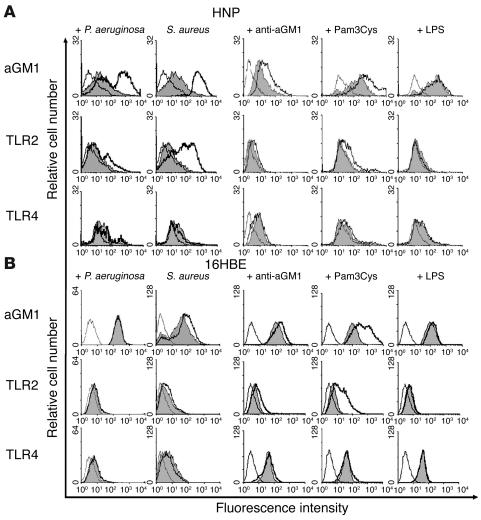
Figure 5.
Mobilization of TLR2 and asialoGM1 in response to bacteria or bacterial ligands. Flow cytometry was used to quantify exposed asialoGM1, TLR2, and TLR4 on primary (HNP) cells (A) or 16HBE cells (B) after stimulation with P. aeruginosa or S. aureus or with monoclonal anti-asialoGM1, Pam3Cys-Ser-Lys4 (Pam3Cys), a TLR2 ligand, or LPS, a TLR4 ligand. Peaks outlined with a thin black line indicate binding by secondary antibody alone; gray-shaded peaks represent the labeled population under control conditions; and peaks demarcated by the heavy black line represent the population after stimulation.

