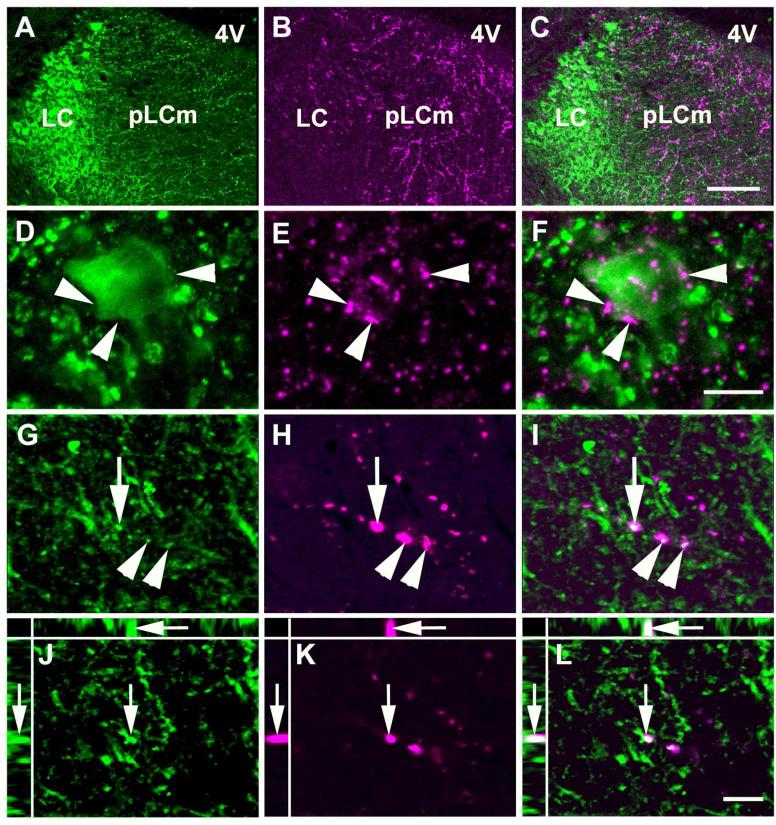
Figure 10.
LC distribution of BDA labeled neuronal fibers projecting from the CAmy. The fibers are densest in the LC dendritic zone, with fewer entering into the LC proper. The images are from the brain with a CeAm BDA injection shown in figure 9A. Panels in the left column show TH-ir, panels in the middle column show BDA labeling and the right column contains merged images. Panels A-C show the LC proper and the rostromedial Peri-LC dendritic zone. Panels D-F show a TH-ir neuron in the LC proper surrounded by BDA containing fibers. Panels G-I show TH-ir positive fibers in the dendritic zone and apparently colocalized BDA containing fibers. Panels J-L are a XYZ presentation (larger panel X-Y, with Y-Z left and X-Z top) of a single optical section from the confocal Z stack in G-I. Arrowheads indicate puncta with possible colocalization between TH-ir and BDA. The arrow points to a TH-ir/BDA puncta with apparent colocalization, that is also shown in the XYZ single optical section. Abbreviations: 4V – fourth ventricle, LC – locus coeruleus, pLCrm – rostromedial pericoerulear region. Scale bar = 100 μm in uppermost panels, 20 μm in the two middle panels and 5 μm in the lowest panels.

