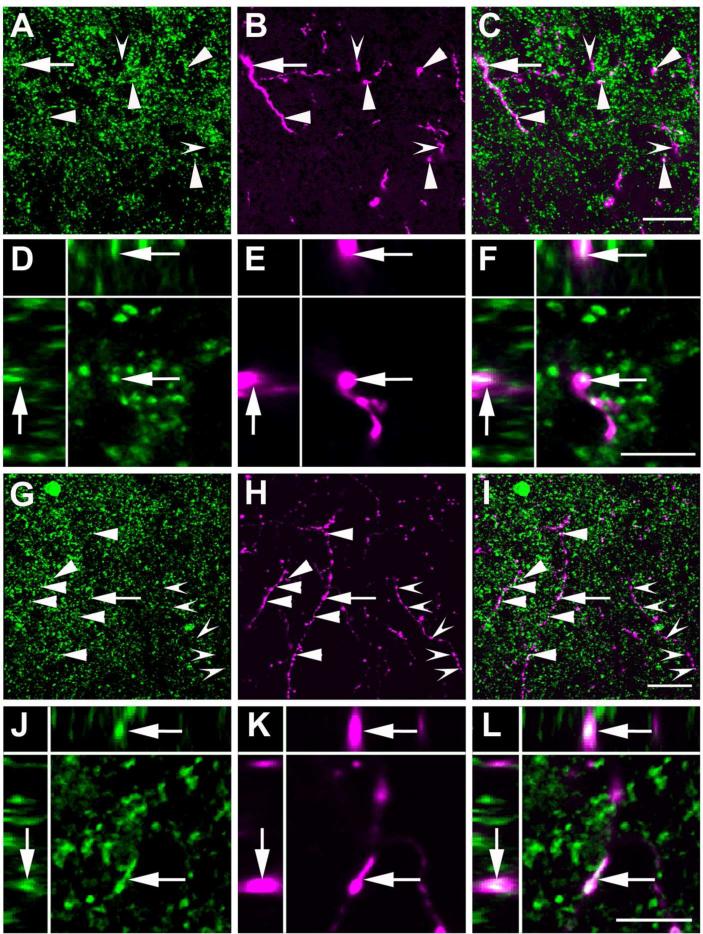
Figure 11.
BDA labeled neuronal fibers projecting from the CAmy into the LC dendritic zone contain GAD65/67-ir. Panels A to F are from a wild-type mouse after BDA injection into the centromedial amydala. Panels A (GAD65/67-ir), B (BDA) and C (merged image) contain a summed confocal Z stack of 10 optical sections collected with a step of 0.42 μm. Panels D-F are a XYZ presentation of a single optical section from the Z stack in A-C. Overlap of GAD65/67-ir and BDA appears white in the merged images in panels C and F. Arrowheads indicate areas with apparent colocalization of GAD65/67-ir and BDA and indented arrowheads point to puncta with only BDA labeling. The arrow points to a region of apparent GAD65/67-ir and BDA colocalization that is shown at higher magnification in single optical sections in the lower panels (larger panel X-Y, with Y-Z left and X-Z top). Panels G to L are from a GAD67-GFP knock-in mouse with a centromedial amygdalar BDA injection. Panels G-I contain summed confocal Z stacks of 10 optical sections collected with a step of 0.42 μm. Panels J-L are a XYZ (larger panel X-Y, with Y-Z left and X-Z top) presentation of single optical sections from the Z stack in G-I. Panels G and J show GFP-ir and panels H and K show BDA labeling. Panels I and L contain merged images. Arrowheads indicate areas with possible colocalization of GFP-ir and BDA and indented arrowheads point to puncta with only BDA labeling. The arrow points to an area containing apparent GFP-ir and BDA co-labeling that is shown at higher magnification in single optical sections in the lower panels. Scale bar = 20 μm in panels A-C and G-I panels and = 5 μm in D-F and J-L.

