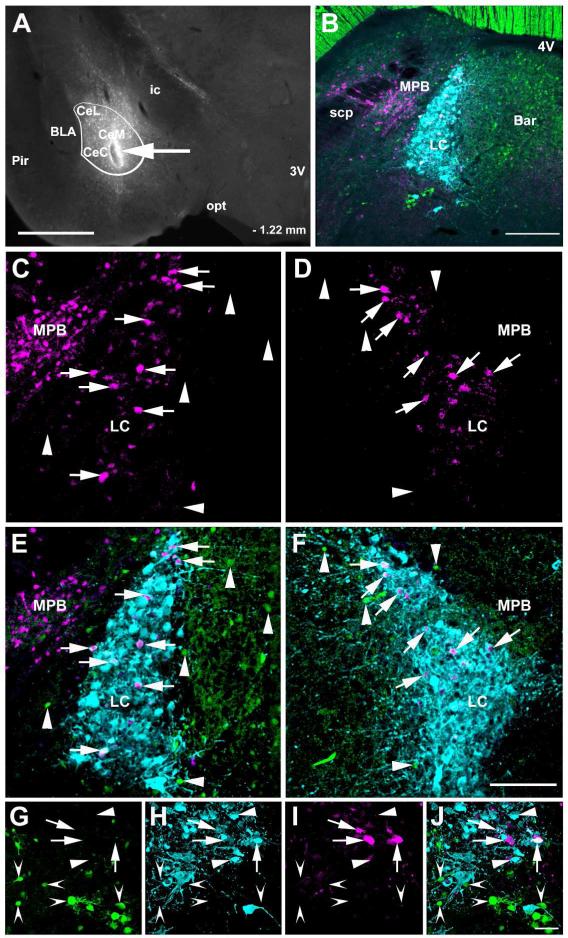
Figure 14.
Transneuronal infection of LC neurons following CAmy injection of herpes simplex 1 virus, strain H129 encoding Cre recombinase dependent tandem dimer Tomato fluorescent protein (HSV1-H129-LStdT). GABAergic neurons in the injected mouse contain Cre recombinase under control of the vesicular GABA transportr gene and a Cre recombinase activated GFP reporter (VGAT-iCre/GFP). Panel A shows a coronal section that includes the amygdala. An arrow points to the injection site and a white line delineates the CAmy. Panel B shows the general distribution of tdTomato containing cells, GABAergic neurons and TH-ir neurons and processes in the LC and Peri-LC zone 72 hours after virus injection. Panel C shows tdTomato in the ipsilateral and panel D the side contralateral to the injection at higher magnification, the images are taken from the same brain section. Panels E and F show viral tdTomato labeling merged with TH-ir and GABAergic labeling. Arrows point to tdTomato containing TH-ir neurons in the LC. Arrowheads point to GABAergic neurons in the Peri-LC zone. Cells containing viral tdTomao are clearly visible in the medial parabrachial nucleus on side ipsilateral but not contralateral to the injection. At higher magnification arrows in panels G (GABAergic neurons), H (TH-ir neurons), I (tdTomato containing cells) and J (merged image) show overlap between LC TH-ir neurons and viral labeled cells while indented arrowheads indicate GABAergic neurons with no indication of virus infection and flat arrowheads uninfected TH-ir neurons. Abbreviations: 3V – third ventricle, 4V – fourth ventricle, Bar – Barrington nucleus, BLA – basolateral amygdala, CeL – centrolateral amygdala, CeM – centromedial amygdala, CeC – centrocentral amygdala, ic – internal capsule, LC – locus ceruleus, MPB – medial parabrachial nucleus, opt – optic tract, Pir – piriform cortex and scp – superior cerebellar pedincule. – 1.22 mm indicates distance to bregma. Scale bar = 500 μm in A and scale bar = 200 μm in B, scale bar = 100 μm in C to F and scale bar = 20 μm in G to J.

