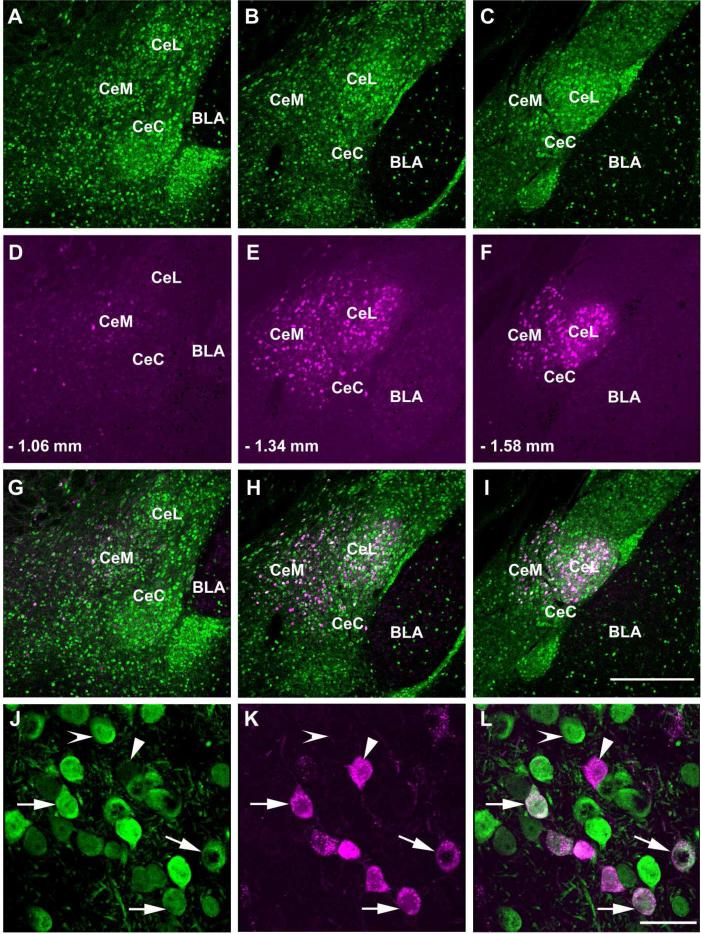
Figure 3.
Distribution of GAD67 expressing cells in the central amygdala (CAmy) that project to the LC. Panels A-C show GAD67-GFP-ir neurons at three coronal levels. Panel D-F (corresponding to the panels just above) show FG-ir labeled neurons in the CAmy after FG injection in the LC. Numbers indicate the distance from bregma. Panels G-I contain merged images of the two panels above them. The largest number of FG containing neurons and FG-ir neurons that colocalize with GAD67-GFP-ir is in the middle section of the CAmy (B, E and H) and the lowest number is in the anterior section (A, D and G). Panels J-L are high magnification images of LC injected FG in centromedial amygdalar GAD67-GFP-ir neurons. Arrows in panel J point to neurons in the centromedial amygdala that coexpress GAD67-GFP-ir and FG (panel K). An arrowhead points to a cell that contains only FG and an indented arrowhead to a neuron with only GAD67-GFP-ir. Panel L contains a merged image. Abbreviations: BLA –basolateral amygdala, CeC - centrocentral amygdala, CeL – centrolateral amygdala, CeM – centromedial amygdala. Scale bar = 500 μm for A to I and scale bar = 20 μm for J to L.

