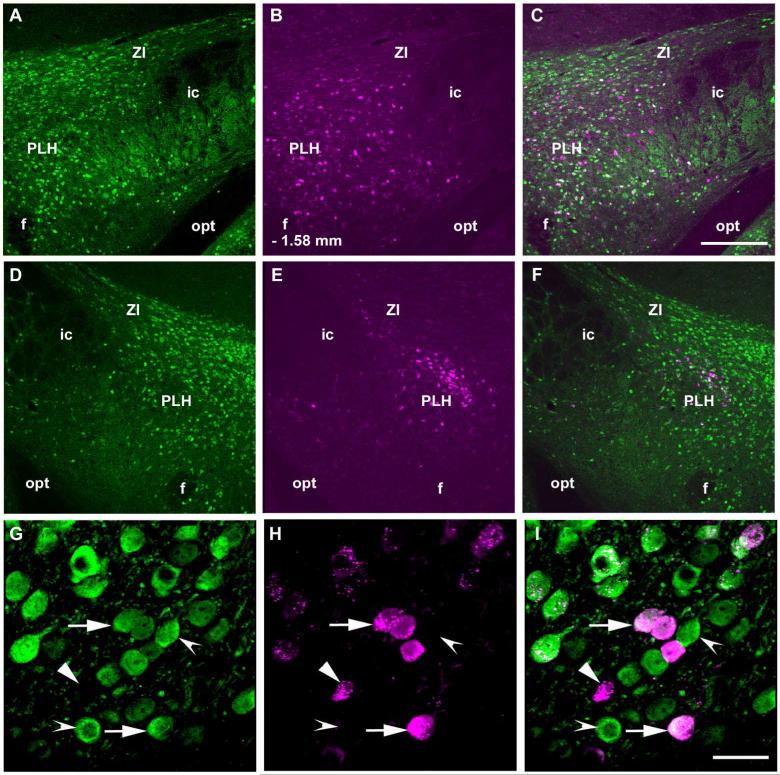
Figure 5.
Distribution of GAD67 expressing cells in the posterior lateral hypothalamus (PLH) that project to the LC. Panels A and D show GAD67-GFP-ir neurons and panels B and E show FG containing neurons. Panel C contains a merged image on the side ipsilateral to the FG injection with numerous neurons that contain both markers. A few double-labeled neurons can be seen in the merged image on the contralateral side (F). In higher magnification images from the ipsilateral side (G-I) colocalization of GAD67-GFP-ir (G) and FG-ir (H) can be more clearly seen. Arrows point to neurons that coexpress GAD67-GFP-ir and FG-ir. The arrowhead points to a cell that contains only FG and the indented arrowhead to a neuron with only GAD67-GFP-ir. Abbreviations: ic – internal capsule, f – fornix, opt – optic tract, PLH – posterior lateral hypothalamus, ZI – zona incerta. −1.58 indicates distance from bregma. Scale bar = 200 m for A to F and scale bar = 20 μm for G to L.

