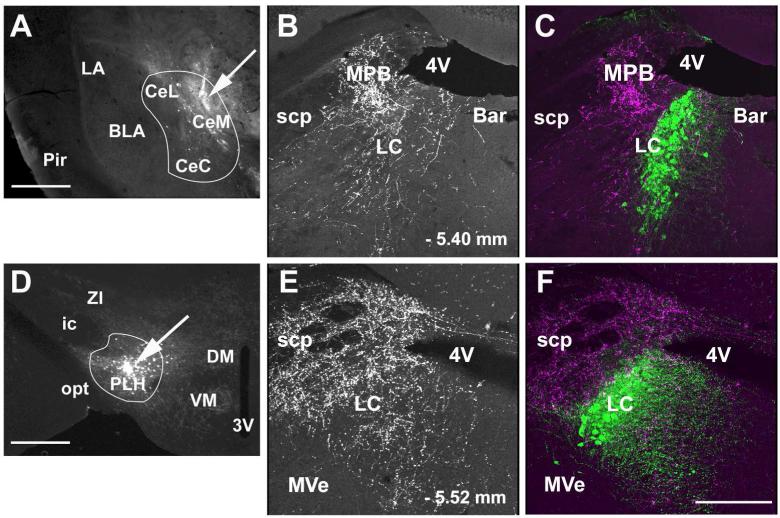
Figure 9.
Anterograde labeling in the LC following CAmy and PLH injection of BDA. Panel A shows a coronal section through the amygdala. An arrow points to a centromedial amygdalar injection site. A white line delineates the CAmy. In Panel D an arrow points to the site of a BDA injection into the PLH. A white line delineates the PLH. Anterogradely labeled fibers are shown in the dorsal pons after BDA injection into the CAmy (B and C) and PLH (E and F). The greatest fiber density is just lateral to the cluster of TH-ir LC neurons after both injections. Both also show a lower density of fibers traversing the LC proper and some fibers present in the rostromedial Peri-LC dendritic zone. Panels B and E show only labeling of the BDA containing fibers. Panels C and F show BDA labeling and TH-ir cells. Abbreviations: 3V – third ventricle, 4V – fourth ventricle, Bar – Barrington nucleus, BLA – basolateral amygdala, CeL – centrolateral amygdala, CeM – centromedial amygdala, CeC – centrocentral amygdala, DMH – dorsomedial hypothalamic nucleus, ic – internal capsule, LC – locus ceruleus, MPB – medial parabrachial nucleus, MVe – medial vestibular nucleus, opt – optic tract, Pir – piriform cortex, PLH – posterior lateral hypothalamus, scp – superior cerebellar pedunculus, SuVe – superior vestibular nucleus, VMH – ventromedial hypothalamic nucleus, ZI – zona incerta. – 1.34mm and – 1.58 mm indicate distance to bregma in A and D; – 5.40 mm and – 5.68 mm indicate distance to bregma in B, C, E and F. Scale bar = 500 μm for A and D and scale bar = 200 μm for B and C, E and F.

