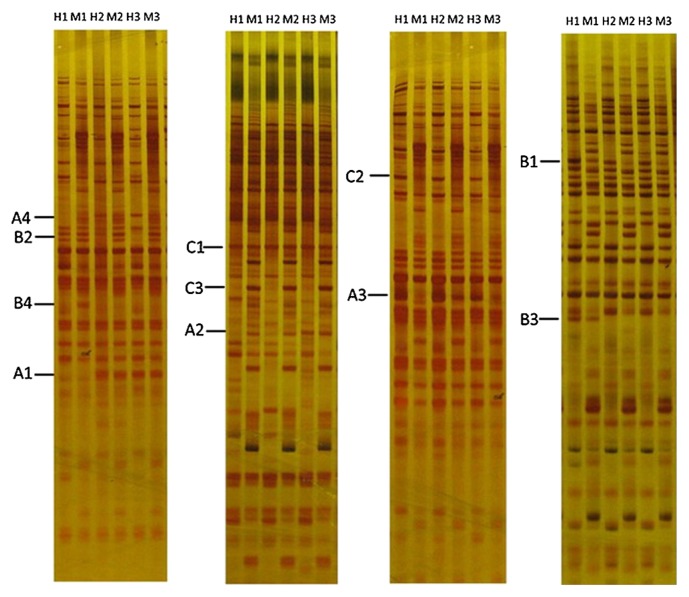
Fig. 2.
MSAP fingerprints of rapeseed seedling between control and heat stress. Lanes H1 and M1 are MSAP patterns of control, lanes H2 and M2 are MSAP of 45°C heat stress, lanes H3 and M3 are MSAP of 45°C heat stress followed 37°C pretreatment. H represent digestion with EcoRI/HpaII, M represent digestion with EcoRI/MspI. Band patterns of A, B, and C can be seen in Table 2.

